- Your accurate, authentic and affordable guide to investing
Flavours of the week April 03, 2005
These are stocks that we expect to out-perform the markets. Cash and derivative strategies are advised thereon. Please stay online to enable loading of graphics from our servers. Please also read the trading tips section at the end of the newsletter.
|
Individual stocks. |
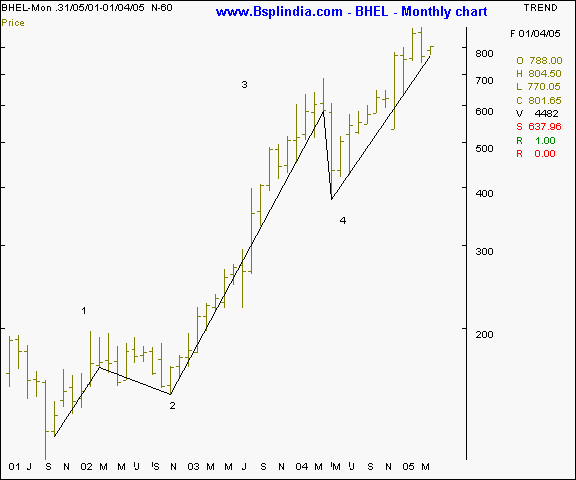
BHEL - this electricals PSU major has been a prolific feature in our recommendations and has been strong market out-performer. The monthly chart below suggests a bullish pattern emerging as the scrip is in the final wave of the upmove. The target for the medium term is 920 levels in a conducive market and we re-iterate our bullish reading on the counter.
Your call of action -
-
Investors / cash segment players - buy the scrip on all declines, keeping room for averaging till the 775 levels and maintain a stop loss at the 750 mark. Expect to book profits at the 900 + levels in the medium term in a conducive market.
-
Aggressive F&O traders - Buy the May futures at 795 levels and hold with a stop loss at the 765 levels. Expect profit taking at the 860 - 870 levels in the medium term in a conducive market scenario.
-
Derivatives contract size - Market lot = 300 shares. F&O margin = approx Rs 64,000 (subject to change daily )
BHEL I BPCL I Hind Lever I HPCL I ITC I Reliance Inds I Satyam Comp I SBI I BSE Sensex I Nifty I CNX-IT I Dow Jones I Nasdaq I FTSE I Top I Close window I Print page
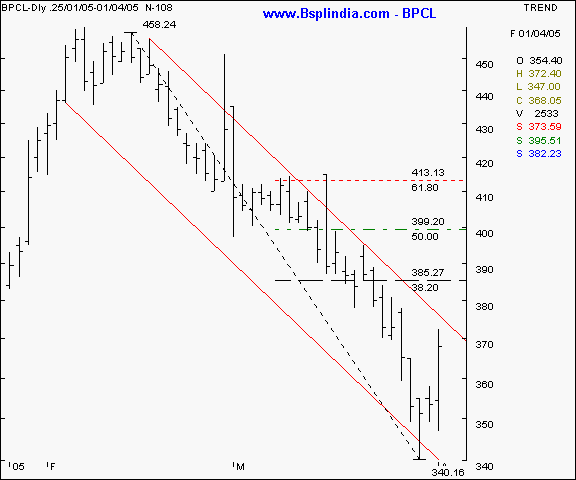
BPCL - this PSU oil refining major is in a downward sloping channel which was formed since early February 2005. Technical traders will note how the upper trendline is acting as a barrier to rallies and witnesses a retracement downwards. The possibility of a pullback to the 380 - 385 levels cannot be ruled out as the big gains made on Friday indicate an oversold scenario in the short term. We feel the rising crude prices in the international markets and stagnant prices in the domestic markets will see unwinding on this counter. We recommend a short sell on this counter.
Your call of action -
-
Investors / cash segment players - exit from delivery based long positions above the 385 levels.
-
Aggressive F&O traders - short sell the April futures at higher levels of 377 and keep a stop loss at the 386 levels. Expect levels of 362 in a fall back into the bearish channel. Income conscious players may sell the April 400 calls at a suggested premium of Rs 5.75 or above.
-
Derivatives contract size - Market lot = 550 shares. F&O margin = approx Rs 34,000 (subject to change daily )
BHEL I BPCL I Hind Lever I HPCL I ITC I Reliance Inds I Satyam Comp I SBI I BSE Sensex I Nifty I CNX-IT I Dow Jones I Nasdaq I FTSE I Top I Close window I Print page
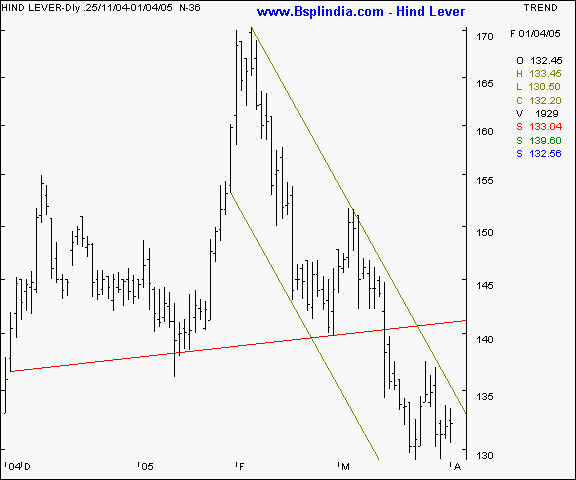
Hind Lever - this FMCG major is in a downtrend and has exhibited a head and shoulder pattern which has bearish implications. The scrip is also moving within a bearish channel with a double bottom at the 128 levels. A bounce back to the 136 or above will present traders opportunities to short sell this counter for gains.
Your call of action -
-
Investors / cash segment players - n/a.
-
Aggressive F&O traders - short sell the April futures above the 137 levels and hold with a stop loss at the 142 mark. Expect to book profits at the 130 - 132 levels in the medium term in a conducive market. Income conscious players can sell the April 150 calls at a suggested premium of Re 1 or above.
-
Derivatives contract size - Market lot = 2,000 shares. F&O margin = approx Rs 45,000 (subject to change daily )
BHEL I BPCL I Hind Lever I HPCL I ITC I Reliance Inds I Satyam Comp I SBI I BSE Sensex I Nifty I CNX-IT I Dow Jones I Nasdaq I FTSE I Top I Close window I Print page
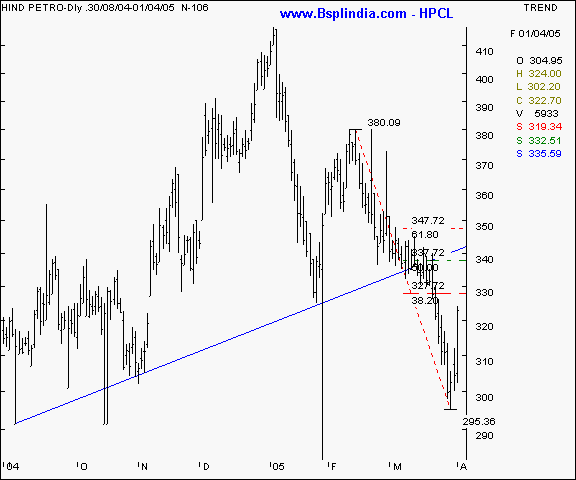
HPCL - This scrip is in a similar scenario as BPCL above and also displays a bearish head and shoulder pattern. Currently, the scrip is exhibiting a pullback which can take the counter all the way to the neckline to the 335 - 340 levels. Short sellers are advised to enter afresh on the counter from the 38 % retracement levels itself at the 328 onwards.
Your call of action -
-
Investors / cash segment players - n/a.
-
Aggressive F&O traders - Start short selling the April futures at higher levels at the 326 / 328 levels and hold with a stop loss at the 338 levels. Expect to book profits below the 310 levels in the near term and near the 300 levels in the medium term. Income conscious players may sell the April 360 calls at a suggested premium of Rs 3 or above.
-
Derivatives contract size - Market lot = 650 shares. F&O margin = approx Rs 34,000 (subject to change daily )
BHEL I BPCL I Hind Lever I HPCL I ITC I Reliance Inds I Satyam Comp I SBI I BSE Sensex I Nifty I CNX-IT I Dow Jones I Nasdaq I FTSE I Top I Close window I Print page
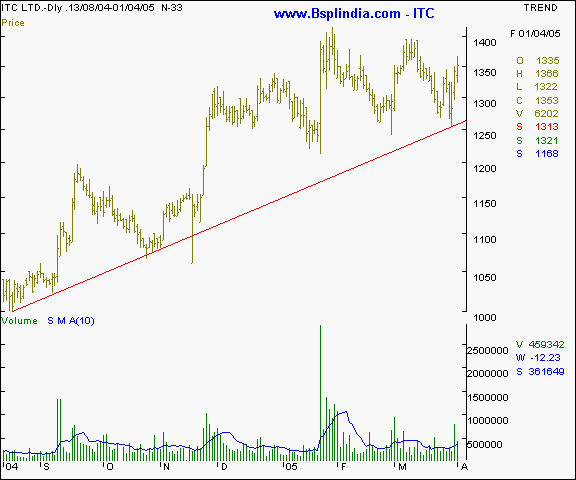
ITC - this scrip is in an uptrend as per this chart as the higher bottoms formation is established. The traded volumes are higher than the 10 day average and the average volumes themselves are rising. We feel the trend on this counter merits a buy recommendation for the medium term investors.
Your call of action -
-
Investors / cash segment players - buy the scrip on all declines ( in a pyramid fashion ) to the 1300 levels and hold with a stop loss at the 1275 mark. Expect to book profits at the 1440 levels in a conducive market in the medium term.
-
Aggressive F&O traders - Buy the April futures on declines to the 1320 levels and average at the 1300 levels. Hold with a stop loss at the 1275 levels. Book profits at the 1380 / 1400 levels in the short / medium term in a conducive market.
-
Derivatives contract size - Market lot = 150 shares. F&O margin = approx Rs 56,000 (subject to change daily )
BHEL I BPCL I Hind Lever I HPCL I ITC I Reliance Inds I Satyam Comp I SBI I BSE Sensex I Nifty I CNX-IT I Dow Jones I Nasdaq I FTSE I Top I Close window I Print page
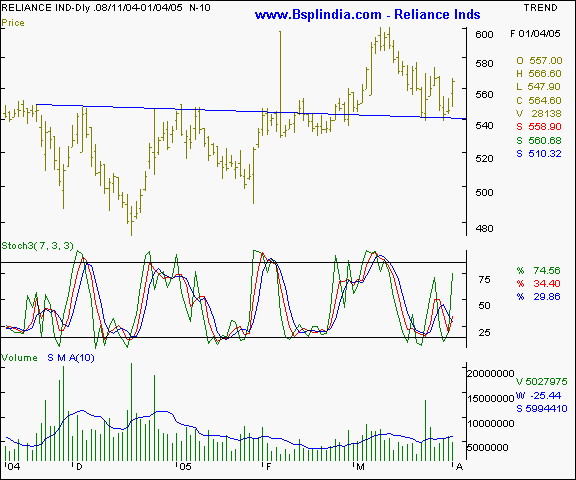
Reliance Inds - This scrip was recommended as a buy ever since an inverted head and shoulder was confirmed above the 542 levels. Note the neckline has acted as a support at the 540 levels and the scrip has made a multiple bottom at these levels. The traded volumes and the price line are in an upswing and and a breakout above the 568 with higher volumes will see the scrip leading a market rally from the front. We recommend a buy as long as the overall market is bullish and the scrip stays above the 560 levels.
Your call of action -
-
Investors / cash segment players - Buy the scrip at current levels and maintain a stop loss at the 550 levels. Expect to book profits at the 580 levels in the short term. In case the markets remain conducive, expect 590 - 595 levels.
-
Aggressive F&O traders - Buy the April futures at the current levels and hold as long as the scrip remains above the 560 levels. Expect to book profits at the 580 - 585 levels in the near term in a conducive market.
-
Derivatives contract size - Market lot = 600 shares. F&O margin = approx Rs 56,000 (subject to change daily )
BHEL I BPCL I Hind Lever I HPCL I ITC I Reliance Inds I Satyam Comp I SBI I BSE Sensex I Nifty I CNX-IT I Dow Jones I Nasdaq I FTSE I Top I Close window I Print page
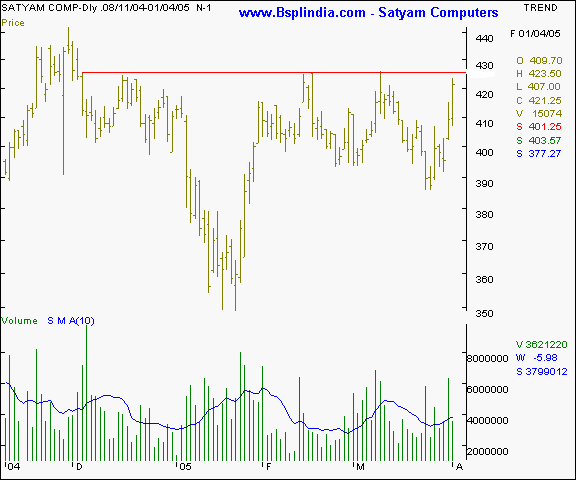
Satyam Computer - This software major is showing an interesting chart pattern. The 425 levels are proving to a be a triple top since November 2004. The scrip has been moving higher since the last 3 sessions with higher volumes. A breakout above the 425 levels on a sustained basis is likely to see a small upmove to the 438 levels in the short term. A speculative grade buy is recommended on the counter.
Your call of action -
-
Investors / cash segment players - Buy the scrip on above the 425 levels and hold with a stop loss at the 416 levels. Expect to book profits at the 438 / 442 levels in the short term.
-
Aggressive F&O traders - Buy the April futures above the 427 levels as long as the scrip trades above this level. Hold with a stop loss at the 422 levels and expect to book profits at the 436 / 438 in the near term in a conducive market in the short term.
-
Derivatives contract size - Market lot = 600 shares. F&O margin = approx Rs 68,000 (subject to change daily )
BHEL I BPCL I Hind Lever I HPCL I ITC I Reliance Inds I Satyam Comp I SBI I BSE Sensex I Nifty I CNX-IT I Dow Jones I Nasdaq I FTSE I Top I Close window I Print page
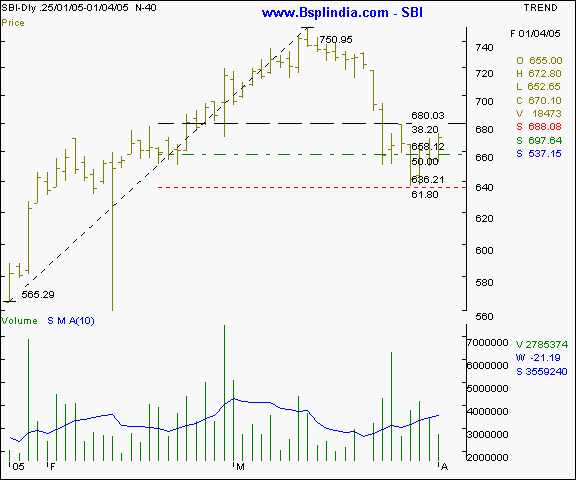
SBI - this PSU banking major has retraced to the 61.80 % levels in a text book fashion and bounced higher. The traded volumes and price action will determine the immediate trend on the counter. A breakout above the 680 levels amidst higher volumes ( above the 10 day average of 36 lac shares / day ) will see higher levels of 700 + in a conducive market scenario. This is a speculative grade recommendation.
Your call of action -
-
Investors / cash segment players - Buy the scrip on a breakout above the 680 levels with higher volumes. Hold with a stop loss at the 668 and expect profit taking at the 700 + levels in the near term in a conducive market scenario.
-
Aggressive F&O traders - Buy the April futures as long as the scrip stays above the 683 levels and hold with a stop loss at the 677 levels. Expect to book profits at the 695 - 698 levels in a conducive market scenario in the short term.
-
Derivatives contract size - Market lot = 500 shares. F&O margin = approx Rs 57,000 (subject to change daily )
|
Indices - domestic |
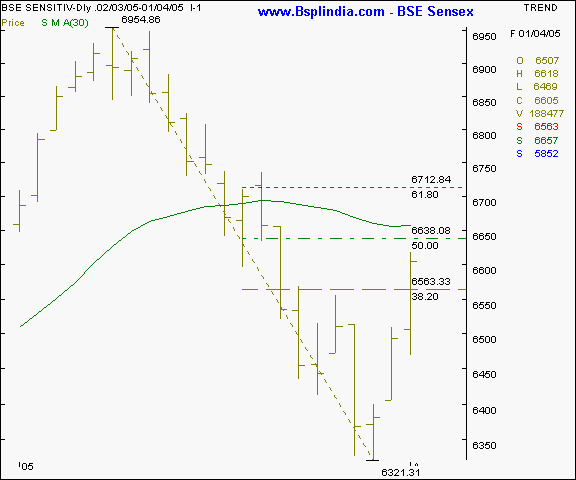
BSE Sensex - the short term chart of the Sensex shows a retracement which will take the index to the 6640 levels in the first phase. Should the upmove sustain itself, expect the next highly optimistic target to be at the 6710 levels. We feel the Sensex will encounter severe resistance at these levels.
Your call of action - Since the Sensex futures are not very liquid, we suggest trading the Nifty 50 instead.
BHEL I BPCL I Hind Lever I HPCL I ITC I Reliance Inds I Satyam Comp I SBI I BSE Sensex I Nifty I CNX-IT I Dow Jones I Nasdaq I FTSE I Top I Close window I Print page
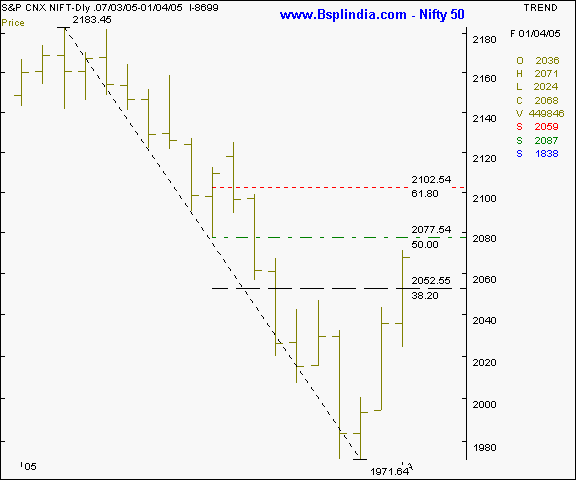
Nifty 50 - The Nifty like the Sensex will see higher levels testing the 2078 - 2085 levels. The 2085 levels are a particularly important threshold as the February 2005 saw multiple resistance at these levels. Should these levels be surpassed, the 2102 levels will be a particularly formidable resistance. Aggressive traders may start short sales at higher levels.
Your call of action - start short selling he Nifty April futures when the spot trades above the 2087 levels and keep shorting at higher levels of 2100 levels. Maintain a stop loss at the 2115 levels. We expect a fall to the 2066 - 2075 levels where shorts maybe covered. Traded volumes must be curtailed in view of the higher volatility. Income conscious traders may sell the April 2170 calls above the 10 premium levels in small lots.
BHEL I BPCL I Hind Lever I HPCL I ITC I Reliance Inds I Satyam Comp I SBI I BSE Sensex I Nifty I CNX-IT I Dow Jones I Nasdaq I FTSE I Top I Close window I Print page
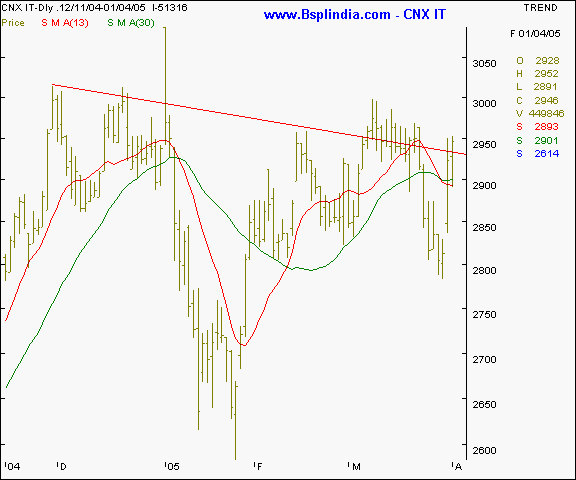
CNX IT - this index is exhibiting an inverted head & shoulder pattern and has bullish implications for the index. A sustained closing above the neckline at the 2940 levels is essential for a confirmed breakout. As long as the 2940 - 2950 levels are overcome, expect a sharp rally in this index over the next few weeks. We recommend a buy.
Your call of action - buy the CNX IT April futures upon a confirmed breakout above the 2950 levels and hold with a stop loss at the 2910 levels. Expect profit taking above the 3000 levels in the short term. Medium term players may expect higher levels of 3030 - 3045 levels.
BHEL I BPCL I Hind Lever I HPCL I ITC I Reliance Inds I Satyam Comp I SBI I BSE Sensex I Nifty I CNX-IT I Dow Jones I Nasdaq I FTSE I Top I Close window I Print page
|
Indices - international |
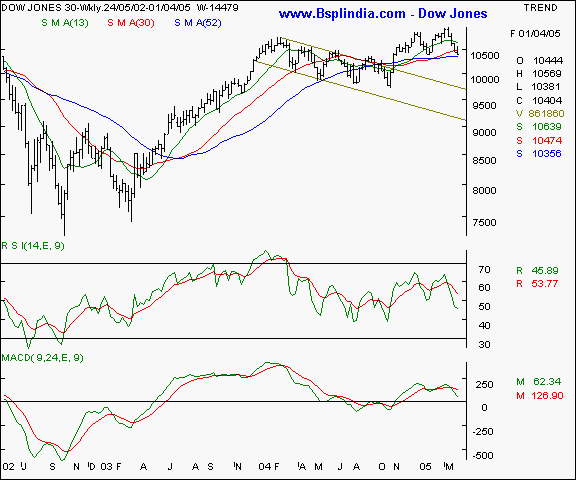
Dow Jones Industrial Average - this old economy index is showing a weakness on the weekly chart and is headed for the long term SMA's. The momentum oscillators are showing weakness and the 10370 levels are a critical support on this index, below which a steeper fall is likely. Upsides are likely to see resistance at the 10600 levels.
Your call of action - this is a pure academic study.
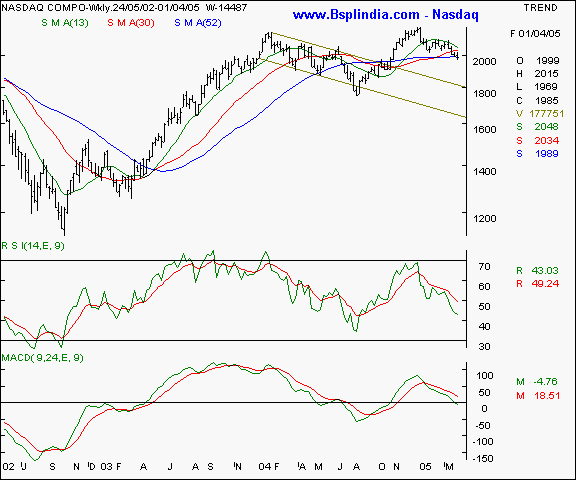
Nasdaq - this new economy index is also showing signs of weakness as the 52 week SMA has been violated on a closing basis. Resistance will be seen at the 2040 levels. Downsides can see 1944 levels.
Your call of action - this is a pure academic study.
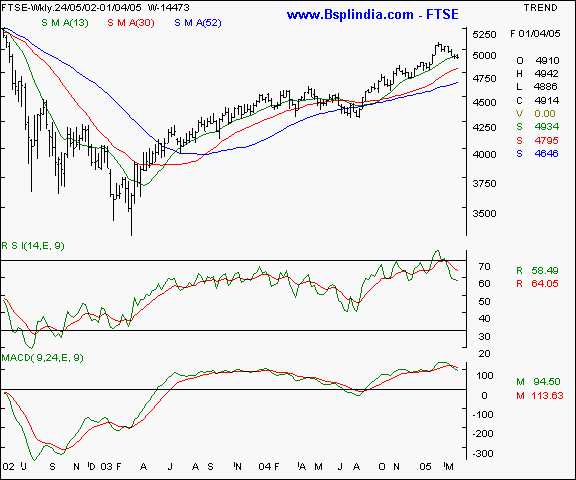
FTSE - this UK index is likley to see some more pressure on the downsides and all rallies are likely to be mere pullbacks. A support at the 4800 levels is likely. A bullishness is likely only above the 5175 levels.
Your call of action - this is a pure academic study.
|
Trading tips for the week |
-
The put / call ratio is falling and is currently at the 0.27 : 1 levels and the outstanding positions in the derivatives segment have shown a fall. The FII investments are continuing steadily, though at a trickle.
-
The current week is crucial for the markets as the indices are likely to test the upward retracement levels. A sustained closing above the 2105 levels alone will signal bullishness.
-
The index heavy-weights are showing strength again. This in turn will boost the indices and cause a feel good factor. The only worry is that this upbeat sentiment should continue.
-
Trades must be executed in small volumes due to the higher volatility expected. Trade fewer counters and conserve cash for future opportunities.
-
Standby for fresh recommendations via SMS on a real - time basis.
- Have a profitable week.
- Vijay L Bhambwani
- Ceo :- Bsplindia.com
The author is a Mumbai based investment consultant and invites feedback at Vijay@BSPLindia.com and ( 022 ) 23438482 / 23400345.
SEBI disclosure :- The author has no positions in any securities mentioned above.
- While all due care has been taken while in compiling the data enclosed herein, we cannot be held responsible for errors, if any, creeping in. Please consult an independent qualified investment advisor before taking investment decisions. This mail is not sent unsolicited, and only advisory in nature. We have accepted no consideration from any company mentioned above and recommend taking decisions on merits of the stocks from our viewpoint. This email is being sent to you as a paid subscriber. Please protect your interests and ours by not disclosing the contents to any un-authorised person/s
Legal notice :- The Professional Ticker Reader is a trademark of Bhambwani Securities (P) Ltd. and any un-authorised replication / duplication in part or full will be infringing our trademark and will result in legal action being enforced on the infringing persons / parties.
