Flavours of the week April 10, 2005
These are stocks that we expect to out-perform the markets. Cash and derivative strategies are advised thereon. Please stay online to enable loading of graphics from our servers. Please also read the trading tips section at the end of the newsletter.
|
Individual stocks. |
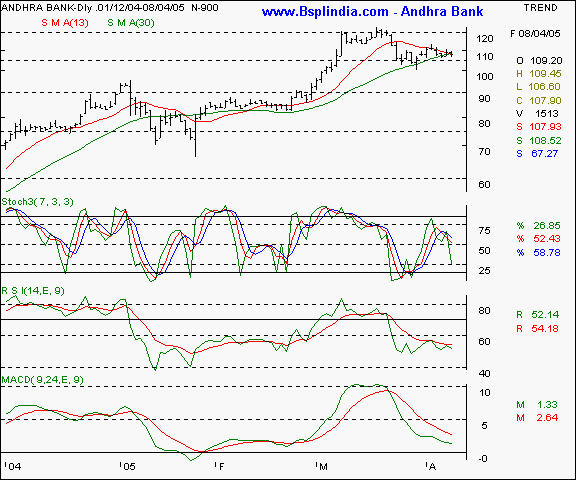
Andhra Bank - we recommended this scrip vide our earlier editions dtd Jan 01, Feb 27 and Mar 26, 2005. Click here to view the previous recommendations. The stock has turned weak after breaking the 112 trailing stop and has trended lower. A conclusive close below the 105 levels will turn the outlook to bearish on the daily charts and a possible downward target of 90 - 92 maybe expected. We recommend a short sale on a confirmed breakdown.
Your call of action -
-
Investors / cash segment players - exit long positions if the scrip starts trading below the 105 mark.
-
Aggressive F&O traders - Short sell the April futures when the spot trades below the 105 levels and the Nifty is trading well below the 2030 levels. In a weak market scenario, expect to book profits at the 92 - 95 levels in a short / medium term time frame. A stop loss on short sales maybe maintained at the 109 levels. Options traders may buy the April 100 puts at Rs 1.50 premium. Income conscious traders may sell the April 130 calls at a suggested premium of Re 1 in small lots only.
-
Derivatives contract size - Market lot = 2,300 shares. F&O margin = approx Rs 55,000 (subject to change daily )
Andhra Bank I Bank of India I BPCL I HPCL I ITC I Telco I BSE Sensex I Nifty I CNX-IT I Dow Jones I Nasdaq I FTSE I Top I Close window I Print page
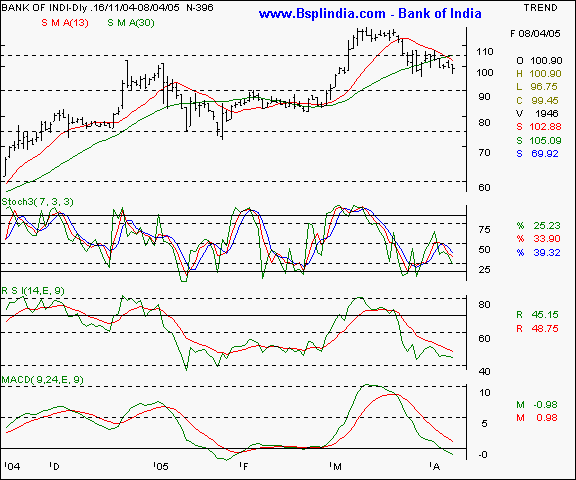
Bank of India - this scrip was recommended vide our earlier editions dtd Jan 22, 2005. Click here to view the previous recommendations. Currently news driven, the scrip may see a small upside where selling is likely. As long as the scrip does not rally past the 105 / 106 levels, the lower tops formation is confirmed. A consistent trade below the 99 levels will see the scrip testing the 90 - 93 levels in a falling market. We recommend a short sale on the counter in a weak market.
Your call of action -
-
Investors / cash segment players - Exit long positions if the scrip trades well below the 99 levels.
-
Aggressive F&O traders - Short the April futures if the spot trades below the 99 mark and the Nifty trades below the 2034 levels in spot. A stop loss at the 104 levels is advocated and a target of 93 is advocated in thge near term. In a weaker market, lower levels are likely. Options players may buy the April 90 puts at a suggested premium of Re. 1
-
Derivatives contract size - Market lot = 1,900 shares. F&O margin = approx Rs 43,000 (subject to change daily )
Andhra Bank I Bank of India I BPCL I HPCL I ITC I Telco I BSE Sensex I Nifty I CNX-IT I Dow Jones I Nasdaq I FTSE I Top I Close window I Print page
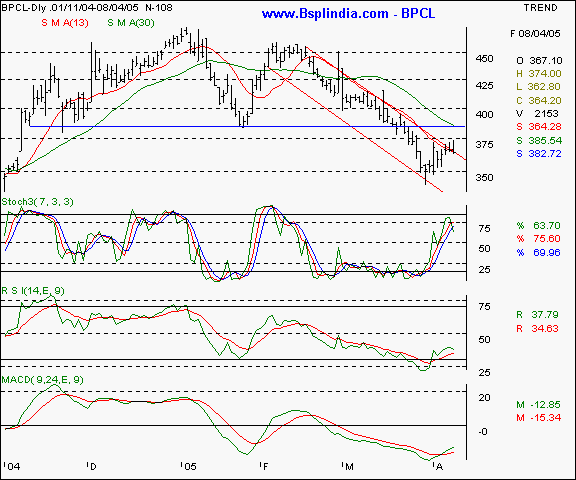
BPCL - This scrip was recommended vide earlier editions dtd Dec 26 2004, Jan 01 & 16, Mar 13 and April 02, 2005. Click here to view the previous recommendations. The stock has exhibited some major technical patterns. Note the head & shoulder formation marked by the blue neckline starting from Nov 04 at the 385 levels. Feb 05 onwards, a bearish channel has formed which is likely to be tested in the coming days. As the international prices of crude fluctuate, the scrip is likely to turn volatile ( refer to the special crude oil / currency edition for details ). A rally to the 385 levels is not ruled out, which is the neckline, the 30 day SMA and a short term retracement level reading. Traders are advocated to short on all advances with a medium term view.
Your call of action -
-
Investors / cash segment players - exit long positions at / near the 385 levels.
-
Aggressive F&O traders - Short the April futures at / above 375 levels and leave room for averaging till the 385 levels. Maintain a stop loss at the 392 levels and expect to book profits at the 345 - 350 levels in the medium term in a conducive market.
-
Derivatives contract size - Market lot = 550 shares. F&O margin = approx Rs 34,000 (subject to change daily )
Andhra Bank I Bank of India I BPCL I HPCL I ITC I Telco I BSE Sensex I Nifty I CNX-IT I Dow Jones I Nasdaq I FTSE I Top I Close window I Print page
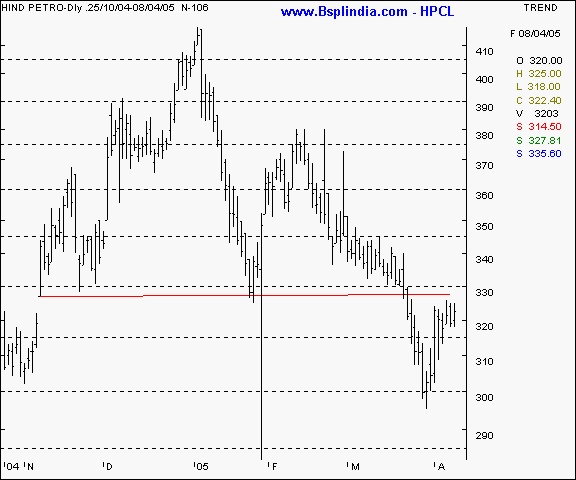
HPCL - This scrip was recommended vide our earlier editions dtd Jan 01 & 16, Mar 13 & 26 and April 02, 2005. Click here to view the previous recommendations. This scrip has also exhibited a head & shoulders formation marked by the red neckline since Nov 2004. Currently, the scrip is newsdriven and also sensitive to the domestic price announcements. As the international prices of crude fluctuate, the scrip is likely to turn volatile ( refer to the special crude oil / currency edition for details ). A pullback to the neckline is not ruled out till the 330 levels. We recommend a short sale bias on the counter.
Your call of action -
-
Investors / cash segment players - start exiting long positions at / above the 330 levels.
-
Aggressive F&O traders - Short sell the April futures below the 317 levels and a room for averaging upto the 325 levels be maintained. Keep a stop loss at the 333 levels and a profit target of 308 - 311 levels be expected in the near term. Over the medium term, expect lower levels.
-
Derivatives contract size - Market lot = 650 shares. F&O margin = approx Rs 35,000 (subject to change daily )
Andhra Bank I Bank of India I BPCL I HPCL I ITC I Telco I BSE Sensex I Nifty I CNX-IT I Dow Jones I Nasdaq I FTSE I Top I Close window I Print page
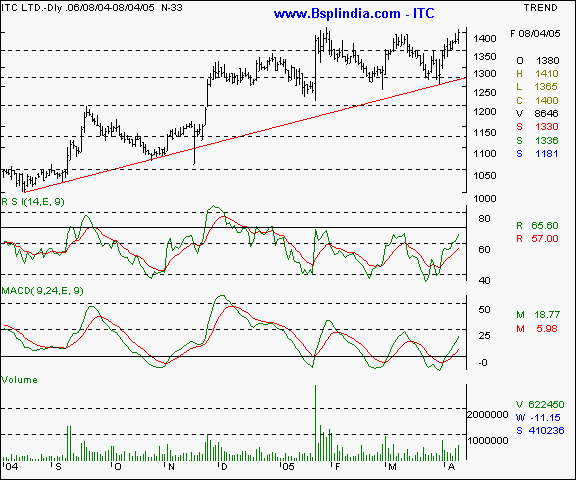
ITC - This scrip was recommended vide our earlier editions dtd Feb 06 & 27, March 06, 13 & 26 and April 02, 2005. Click here to view the previous recommendations. The stock has clearly defied the general market trend and rallied to it's lifetime high area. As the chart below indicates, the outlook for the scrip is bullish and the upward sloping trendline is an indicator of that. While the scrip makes a higher bottom consistently, a higher top was awaited, which has been achieved now. A consistent close above the 1400 levels will be a conclusive bullish indicator. The oscillators are confirming the bullishness and the traded volumes show a rise which is a confidence inspiring factor. We maintain a bullish outlook for this scrip for the medium / long term players.
Your call of action -
-
Investors / cash segment players - we recommend a buy on the counter on all major declines, preferably at the 1375 - 1380 levels. Maintain a room for averaging till the 1300 levels. Expect profit taking at the 1500 - 1540 levels in the near / medium term. Over a longer period, expect higher levels.
-
Aggressive F&O traders - Buy the May futures at the 1370 levels and hold with a stop loss at the 1310 levels. Expect to book profits at the 1460 - 1480 levels in the near / medium term in a conducive market.
-
Derivatives contract size - Market lot = 150 shares. F&O margin = approx Rs 35,000 (subject to change daily )
Andhra Bank I Bank of India I BPCL I HPCL I ITC I Telco I BSE Sensex I Nifty I CNX-IT I Dow Jones I Nasdaq I FTSE I Top I Close window I Print page
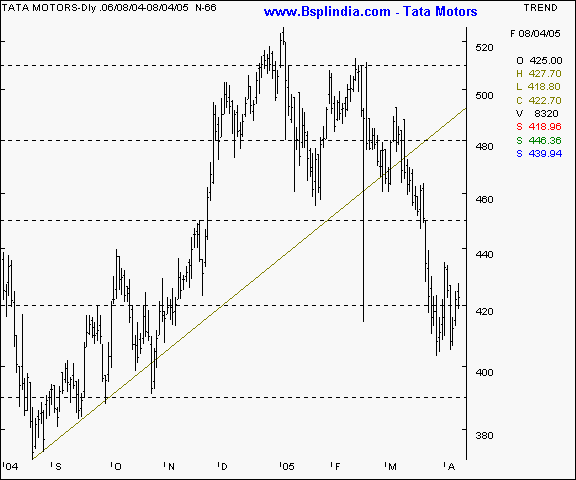
Telco - This scrip was recommended vide editions dtd Nov 11 2004, Jan 16, March 13, 20 & 26 2005. Click here to view the previous recommendations. The short sale recommendation below the 460 levels has turned out to be highly profitable and we feel the scrip may see some bounce-back as the short term readings point towards an oversold level. Advanced retracement studies point towards a pullback to the 437 / 448 levels. Short sales at these levels are advised depending on the risk appetite of the traders. Lower risk appetite players may await the higher band for short selling.
Your call of action -
-
Investors / cash segment players - sell the cash long positions at / above 445 levels in staggered lots and exit completely by the 465 levels.
-
Aggressive F&O traders - Short sell the May series at higher levels above the 435 levels and keep room for averaging till the 446 levels. Maintain a stop loss at the 457 levels. Expect to book profits at the 415 / 420 levels in the near term. Over the medium term, expect lower prices in a conducive market. Options players can buy the April 420 puts at a suggested premium of Rs 8. Income conscious players can sell the April 460 calls at a suggested premium of Rs 3.
-
Derivatives contract size - Market lot = 825 shares. F&O margin = approx Rs 60,000 (subject to change daily )
|
Indices - domestic |
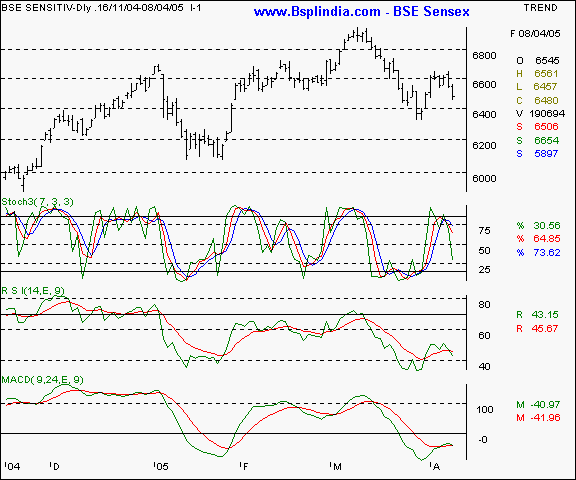
BSE Sensex - the Sensex has turned lower from a confirmed retracement level and a sustained trade below the 6549 levels will see a further 100 point drop. Upsides are likely till the 6555 levels where minor reistance is likely. The 6610 levels are likely to be a more major hurdle for the Sensex. The outlook is that of weakness on this index. The oscillators too point towards a fall in the near / medium term.
Your call of action - Since the Sensex futures are not very liquid, we suggest trading the Nifty 50 instead.
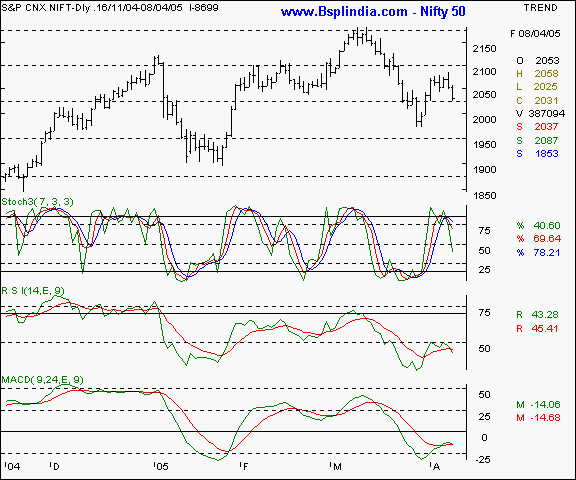
Nifty 50 - The Nifty has closed below the 2034 levels, which was a meaningful February month long support. A sustained trade below the 2018 levels will confirm weakness and the Nifty may test the 1971 levels all over again, if the 2004 levels do not hold. Watch the 2018 / 2004 levels in the coming week. below these levels, expect continued weakness. The oscillators are confirming weakness and the upsides are unlikely to see levels above 2060.
Your call of action - Short sell the Nifty April futures on advances to the 2045 / 2050 levels ( spot levels ) or short if the 2018 levels are violated downwards in spot. Immediate support will be the 2004 levels, where part profit taking be resorted to, complete squaring up advocated at the 1986 levels. Options players may buy the April 1950 puts at Rs 10. Income conscious players can sell the April 2130 calls at Rs 8 in small lots.
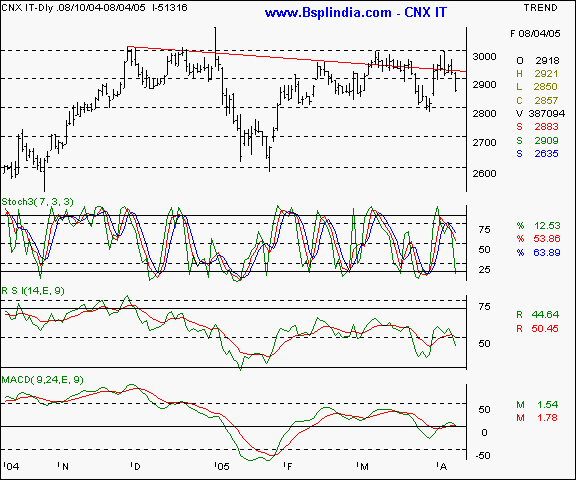
CNX IT - this IT index held out great hopes since this sector is insulated from the crude and inflation factors. The chart pattern shows an inverted head & shoulder formation which if confirmed, had signalled a bullish phase commencing. However, the index has retraced from the neckline and confirmed the 2950 level as a multiple top. The index can retrace to the 2800 levels or below in the coming few weeks.
Your call of action - Since these futures are not very liquid, we suggest trading the Nifty 50 instead.
|
Indices - international |
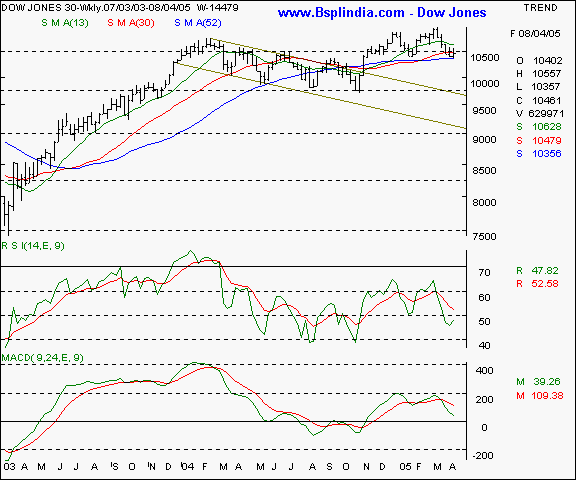
Dow Jones Industrial Average - this NYSE index has settled at the 52 week SMA as the downward pressure continues. Watch the 10350 levels for support in the immediate future and the 10625 levels for resistance in the coming week. There is a likelihood of a pullback in the near term.
Your call of action - This is a pure academic study.
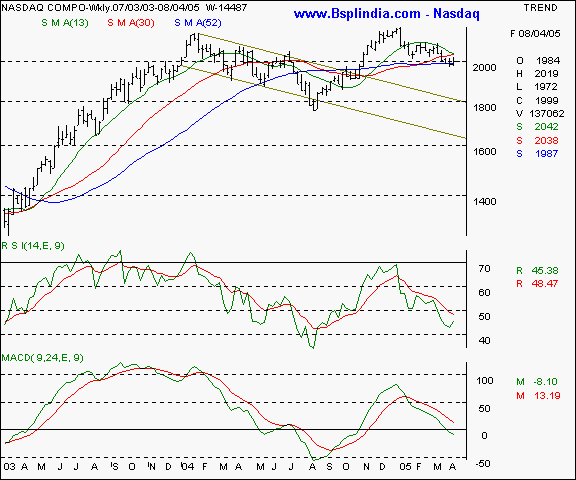
Nasdaq - this showing a weaker trend as compared to the Dow and will have an impact on the domestic technology stocks as well. A consistent trade below the 1975 levels will be a confirmation of weakness and the Nasdaq can test the 1929 levels in that case. Upsides will see resistance at the 2045 levels in the near term.
Your call of action - this is a pure academic study.
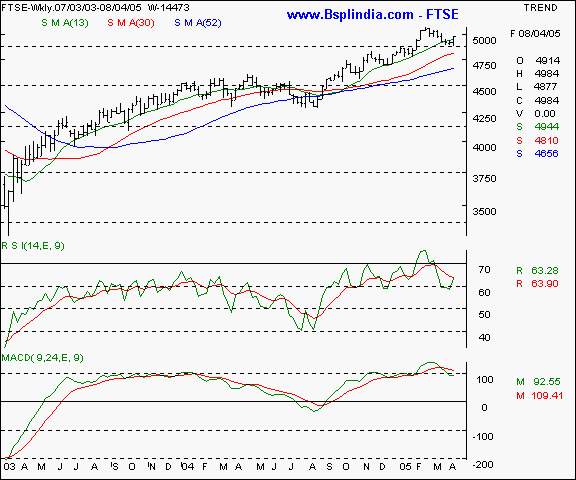
FTSE - this UK index is showing relative out-performance in the near term as compared to the US indices. Ample support exists at the 4850 levels and resistance is likely at the 5120 levels in the coming week.
Your call of action - this is a pure academic study.
|
Trading tips for the week |
-
The put / call ratio is stagnant and is currently at the 0.28 : 1 levels and the outstanding positions in the derivatives segment have shown a quantitative slide. The FII investments are continuing steadily, though at a trickling pace.
-
There is offloading at higher levels in stock futures. That indicates a cautious approach as long positions in individual stocks is being hedged by Nifty shorts.
-
The coming week is crucial for the markets as the previous bottoms need to hold, or else, the indices may test new lows.
-
Trades must be executed in small volumes due to the higher volatility expected. Trade fewer counters and conserve cash for future opportunities.
-
Standby for fresh recommendations via SMS on a real - time basis.
- Have a profitable week.
- Vijay L Bhambwani
- Ceo :- Bsplindia.com
The author is a Mumbai based investment consultant and invites feedback at Vijay@BSPLindia.com and ( 022 ) 23438482 / 23400345.
SEBI disclosure :- The author has no positions in any securities mentioned above.
- While all due care has been taken while in compiling the data enclosed herein, we cannot be held responsible for errors, if any, creeping in. Please consult an independent qualified investment advisor before taking investment decisions. This mail is not sent unsolicited, and only advisory in nature. We have accepted no consideration from any company mentioned above and recommend taking decisions on merits of the stocks from our viewpoint. This email is being sent to you as a paid subscriber. Please protect your interests and ours by not disclosing the contents to any un-authorised person/s
Legal notice :- The Professional Ticker Reader is a trademark of Bhambwani Securities (P) Ltd. and any un-authorised replication / duplication in part or full will be infringing our trademark and will result in legal action being enforced on the infringing persons / parties.

