Flavours of the week April 17, 2005
These are stocks that we expect to out-perform the markets. Cash and derivative strategies are advised thereon. Please stay online to enable loading of graphics from our servers. Please also read the trading tips section at the end of the newsletter.
|
Individual stocks. |
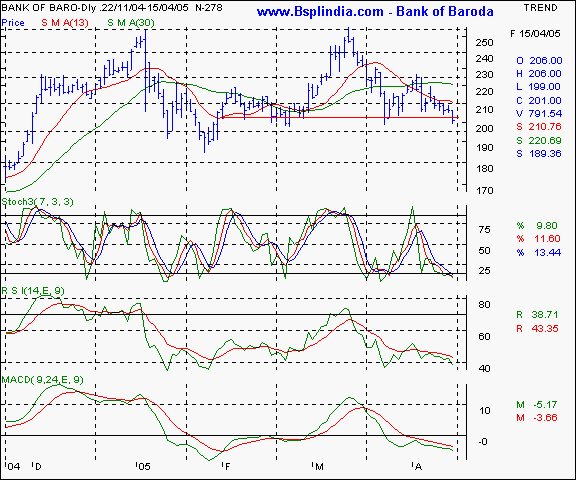
Bank Of Baroda - this PSU banking scrip is in a bear grip as the pattern of lower tops and bottoms continues. Noteworthy is the fact that the closing has been below an important trendline which marks a quarter long support. The trendline also happens to be a neckline of a head and shoulder pattern. That implies a continued weakness on the counter as long as it stays below the neckline. In a textbook head and shoulder pattern, a pullback is generally witnessed before a big fall. Traded volumes must be really high on a confirmed breakdown to trigger a short sale decision.
Your call of action -
-
Investors / cash segment players - n/a.
-
Aggressive F&O traders - short the May futures as long as it stays below the 200 mark and maintain a stop loss at the 210 levels. Expect to book profits at the 182 - 188 levels in a conducive market scenario in the medium term. We advocate minimal sized exposure on this trade.
-
Derivatives contract size - Market lot = 1,400 shares. F&O margin = approx Rs 57,000 (subject to change daily )
Bank of Baroda I HDFC Bank I Reliance Inds I Tata Power I Tata Motor I Union Bank I BSE Sensex I Nifty I CNX-IT I Dow Jones I Nasdaq I FTSE I Top I Close window I Print page
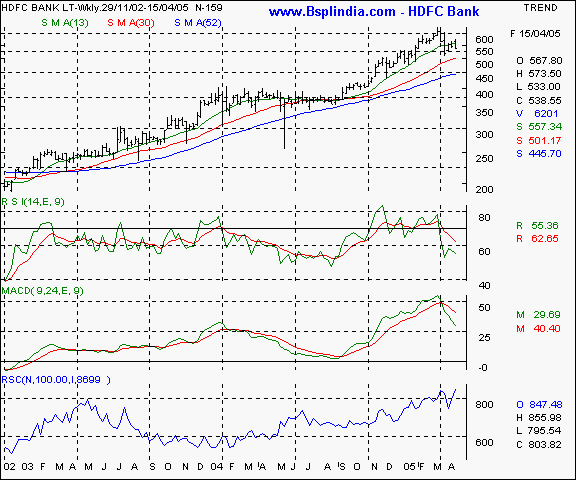
HDFC Bank - this scrip has been one of the most prolific and the most profitable recommendation from us in recent times. The very high relative strength of 847 ( where 100 = base ) is confidence inspiring. We feel a fall to the 500 levels is likely as the lower tops formation is seen. Patient investors can initiate long positions from this level and buy in a pyramid pattern for long term gains.
Your call of action -
-
Investors / cash segment players - start buying at / around 500 levels and leave room for averaging till the 460 mark. Maintain a liberal stop loss at the 430 levels. We expect the scrip to re-test the 600 levels in the medium / long term in a conducive market. Buying is recommended in a pyramid formation.
-
Aggressive F&O traders - buy the May futures at lower levels of 510 - 515 and leave room for averaging lower till the 495 levels. A stop loss is advocated at the 475 mark. Expect profit taking partially at the 550 levels and 580 levels completely in the medium term.
-
Derivatives contract size - Market lot = 400 shares. F&O margin = approx Rs 36,000 (subject to change daily )
Bank of Baroda I HDFC Bank I Reliance Inds I Tata Power I Tata Motor I Union Bank I BSE Sensex I Nifty I CNX-IT I Dow Jones I Nasdaq I FTSE I Top I Close window I Print page
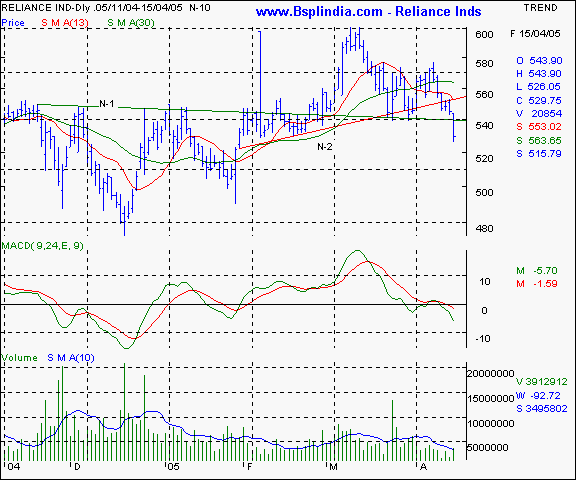
Reliance Inds - We advocated a bullish position in Reliance in Feb / Mar 2005 on the basis of a bullish head & shoulder formation which indicated a target price of 603 levels - which was more or less achieved. That neckline is marked as N-1 in green in the graphic below. Notice a second head and shoulder ( bearish this time ) marked by a red trendline ( N-2) in the graphic. A close below the 551 levels with high volumes has confirmed this head and shoulder and we recommended a short sell on this scrip on Friday with a target of 528. It was a very successful trade. Being a measuring move, it is possible to forecast the prices in this pattern and we feel a 495 - 505 range is likely in Reliance. The 520 levels should be violated consistently on the downside.
Your call of action -
-
Investors / cash segment players - n/a.
-
Aggressive F&O traders - Short sell the May futures at the 538 mark and maintain a stop loss at the 544 - 546 levels. Expect to book profits partially at the 523 and 514 completely in a conducive market scenario. Options players may contemplate buying April 500 puts at a premium of Rs 2 or below.
-
Derivatives contract size - Market lot = 600 shares. F&O margin = approx Rs 55,000 (subject to change daily )
Bank of Baroda I HDFC Bank I Reliance Inds I Tata Power I Tata Motor I Union Bank I BSE Sensex I Nifty I CNX-IT I Dow Jones I Nasdaq I FTSE I Top I Close window I Print page
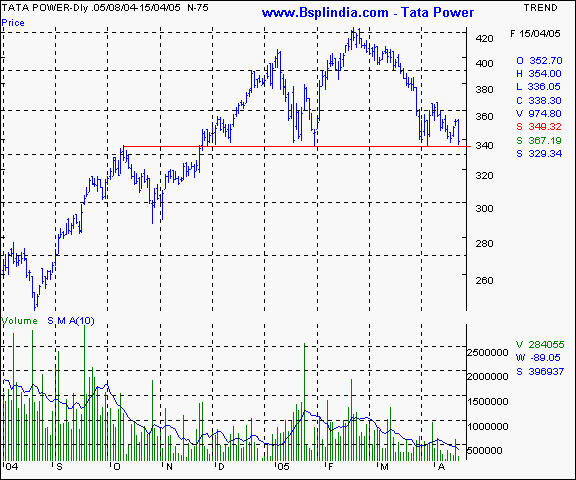
Tata Power - this scrip was recommended as a short sale candidate - a recommendation that went haywire recently. The basis of this view is the medium term trendline at the 335 levels which is a crucial threshold level for this counter. This trendline has held ground on 4 occassions since Oct 2004 and is likely to get violated. The lower top formation in March is a pre-cursor to that event. A confirmed fall below the 335 levels with heavy volumes will also confirm a head and shoulders formation which will take the scrip to the 300 - 310 levels in a weak market.
Your call of action -
-
Investors / cash segment players - n/a.
-
Aggressive F&O traders - short the May futures once a consistent and conclusive fall below the 335 levels is achieved with high volumes. Maintain a stop loss at the 350 levels and a profit target of 315 - 320 in the near term in a weak market and 300 levels in the short / medium term in a conducive market.
-
Derivatives contract size - Market lot = 800 shares. F&O margin = approx Rs 48,000 (subject to change daily )
Bank of Baroda I HDFC Bank I Reliance Inds I Tata Power I Tata Motor I Union Bank I BSE Sensex I Nifty I CNX-IT I Dow Jones I Nasdaq I FTSE I Top I Close window I Print page
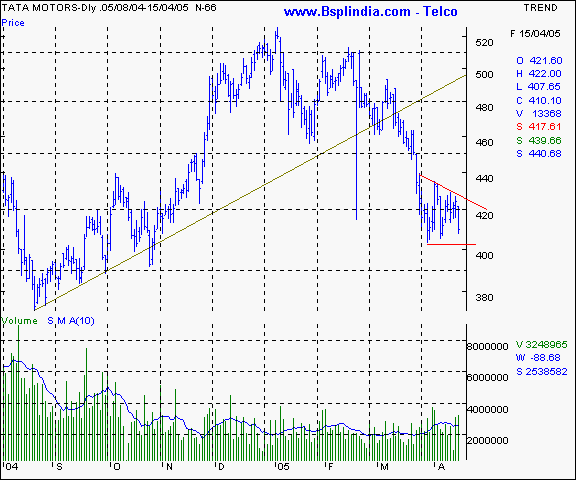
Tata Motors - this scrip was constantly recommended by us as a short sale candidate ever since it violated the 465 mark. A pullback from the 403 levels has seen a lower tops formation which has seen the scrip unable to surpass the 438 levels on a closing basis. Any breakdown below the 403 levels will confirm a bearish trend and signal a steeper fall in the near term. Technical traders will note that the falls are on higher volumes. A bearish indicator.
Your call of action -
-
Investors / cash segment players - n/a.
-
Aggressive F&O traders - short the May futures once the cash price is conclusively below the 403 levels and maintain a stop loss at the 416 levels. Expect to book profits at the 390 levels partially in the short term and 378 levels totally in the medium term in a conducive market.
-
Derivatives contract size - Market lot = 825 shares. F&O margin = approx Rs 59,000 (subject to change daily )
Bank of Baroda I HDFC Bank I Reliance Inds I Tata Power I Tata Motor I Union Bank I BSE Sensex I Nifty I CNX-IT I Dow Jones I Nasdaq I FTSE I Top I Close window I Print page
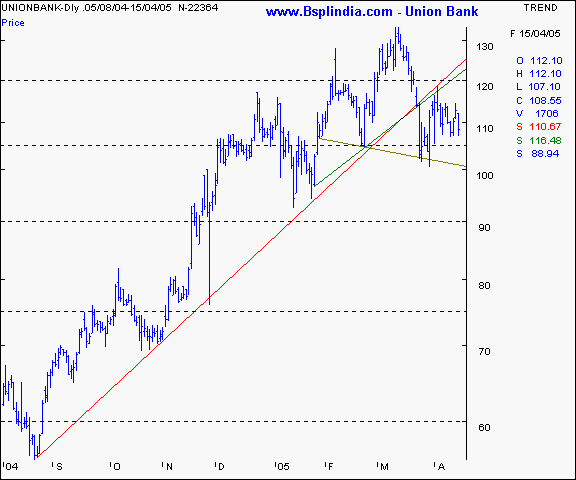
Union Bank of India - this scrip was recommended by us a bearish scrip once a level below 112 was achieved. Technical traders may note the violation of the longer trendline was in a text book fashion and a pullback to the same was seen in March end 2005. A higher top was not made and the tone was set as bearish. Any conclusive closing below the 105 levels consistently will see the scrip take a pounding in the near term.
Your call of action -
-
Investors / cash segment players - n/a.
-
Aggressive F&O traders - short sell the May futures once the spot closes conclusively below the 105 levels. Maintain a stop loss at the 109 levels and expect to book profits at the 100 levels in the immediate future and 95 levels in an exceptionally weak scenario.
-
Derivatives contract size - Market lot = 2,100 shares. F&O margin = approx Rs 52,000 (subject to change daily )
Bank of Baroda I HDFC Bank I Reliance Inds I Tata Power I Tata Motor I Union Bank I BSE Sensex I Nifty I CNX-IT I Dow Jones I Nasdaq I FTSE I Top I Close window I Print page
|
Indices - domestic |
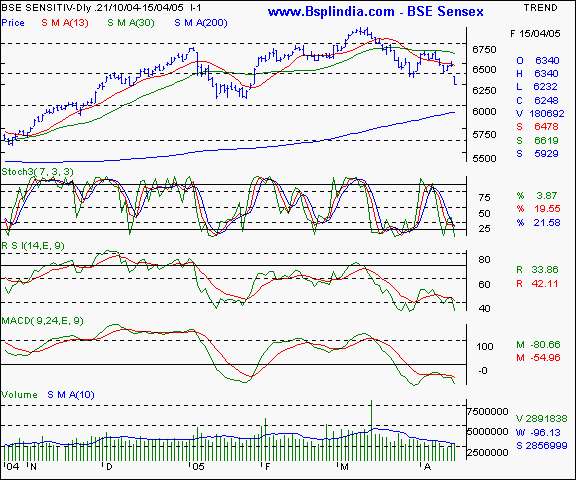
BSE Sensex - the sensex has fallen with a gap and is likely to see some technical bounce due to a corrective reason. However, upsides above 6400 - 6420 seem unlikely and a fresh fall is not ruled out. Our view on the Sensex is that of caution and we advocate a level of 6150 in the coming days.
Your call of action - Since the Sensex futures are not very liquid, we suggest trading the Nifty 50 instead
Bank of Baroda I HDFC Bank I Reliance Inds I Tata Power I Tata Motor I Union Bank I BSE Sensex I Nifty I CNX-IT I Dow Jones I Nasdaq I FTSE I Top I Close window I Print page
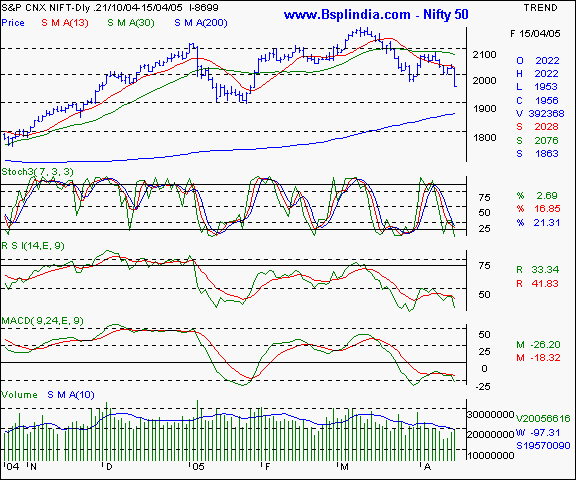
Nifty 50 - the Nifty is precariously poised at a threshold level support at the 1950 levels. A pullback to the 1980 - 1984 levels is possible and selling resistance will commence thereafter. The Nifty can see 1910 - 1922 levels in the coming week in case of further selling. The 1900 levels will be a reasonably strong support area for the Nifty.
Your call of action - sell the deeply out of money calls in the April series at the 2050 levels at Rs 6, May series at 2100 strike at Rs 12. Short sell the April futures at higher levels of 1970 and hold with a stop loss at the 1988. Expect profit taking at the 1950 - 1960 band in the short / medium term in a conducive market.
Bank of Baroda I HDFC Bank I Reliance Inds I Tata Power I Tata Motor I Union Bank I BSE Sensex I Nifty I CNX-IT I Dow Jones I Nasdaq I FTSE I Top I Close window I Print page
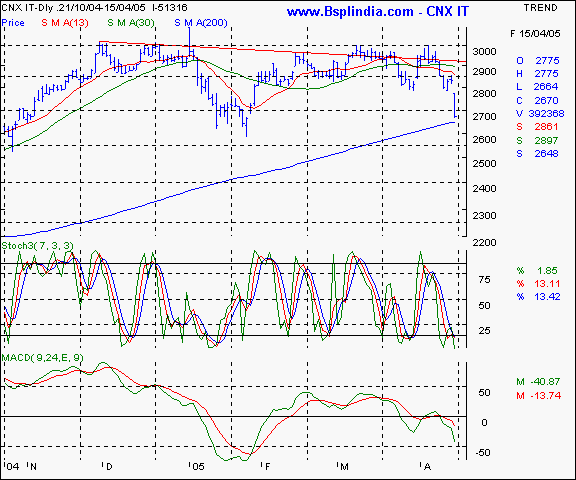
CNX IT - this technology index has seen a retracement from what promised to be an inverted head and shoulder pattern and a steep fall thereafter. We feel a pullback from the 200 day SMA maybe witnessed and a fresh fall is not ruled out after the bounce.
Your call of action - Since the CNX IT futures are not very liquid, we suggest trading the Nifty 50 instead.
Bank of Baroda I HDFC Bank I Reliance Inds I Tata Power I Tata Motor I Union Bank I BSE Sensex I Nifty I CNX-IT I Dow Jones I Nasdaq I FTSE I Top I Close window I Print page
|
Indices - international |
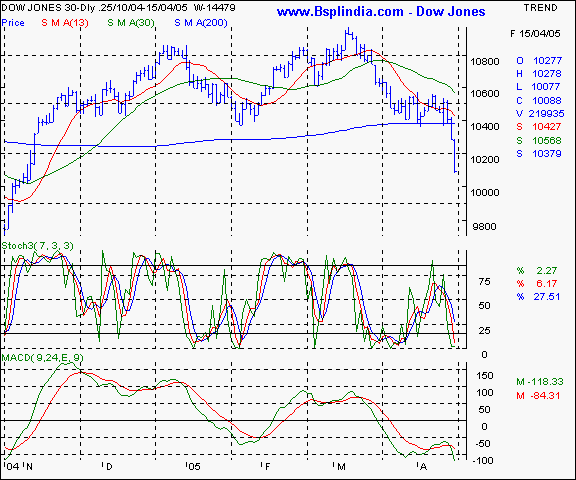
Dow Jones Industrial Average - this NYSE index is at it's lowest in 5 months and further weakness is in the offing as profit warnings and economic data start trickling in. The 200 day SMA has been violated and the 10350 levels are now a formidable short term resistance. The Dow is likely to test the 9888 levels in the coming days.
Your call of action - this is a pure academic study.
Bank of Baroda I HDFC Bank I Reliance Inds I Tata Power I Tata Motor I Union Bank I BSE Sensex I Nifty I CNX-IT I Dow Jones I Nasdaq I FTSE I Top I Close window I Print page
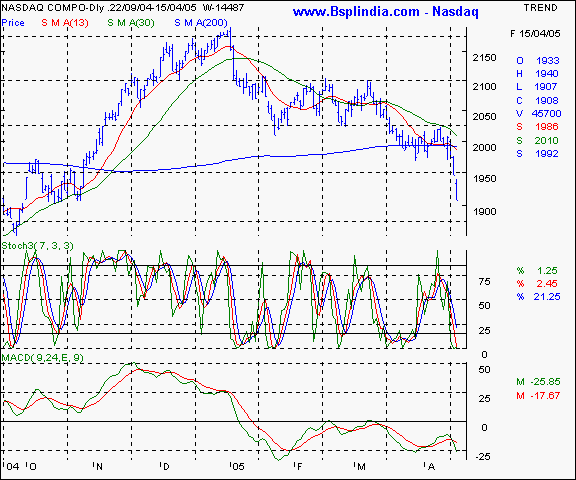
Nasdaq - this technology / biotech index has shown a sharp fall in tandem with the Dow Jones and is headed for the sub 1850 levels. Similar to the Dow, the 200 day SMA has been violated and will act as a barrier on the upsides.
Your call of action - this is a pure academic study.
Bank of Baroda I HDFC Bank I Reliance Inds I Tata Power I Tata Motor I Union Bank I BSE Sensex I Nifty I CNX-IT I Dow Jones I Nasdaq I FTSE I Top I Close window I Print page
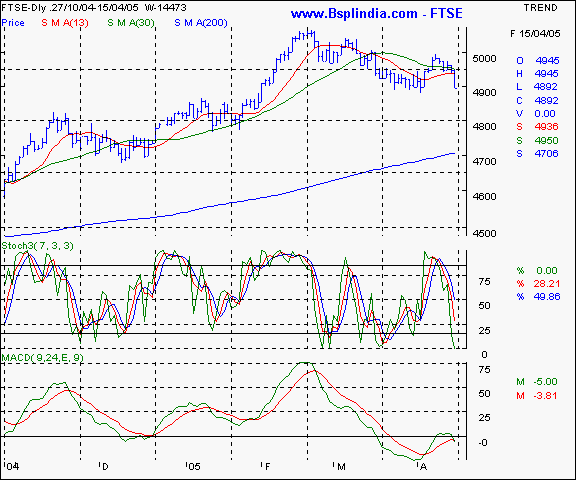
FTSE - this US index has shown higher relative strength as compared to the US indices and we expect minor support at the 4810 levels. Upsides will see resistance at the 4955 levels and the chances of 4800 in the short term are fair.
Your call of action - this is a pure academic study.
Bank of Baroda I HDFC Bank I Reliance Inds I Tata Power I Tata Motor I Union Bank I BSE Sensex I Nifty I CNX-IT I Dow Jones I Nasdaq I FTSE I Top I Close window I Print page
|
Trading tips for the week |
-
The put / call ratio is easing and is currently at the 0.27 : 1 levels and the outstanding positions in the derivatives segment have shown a qualitative sluggishness. The FII investments are continuing at a trickle.
-
There is offloading at higher levels in stock futures. That indicates a cautious approach as long positions in individual stocks is being hedged by Nifty shorts.
-
The index heavy-weights are showing weakness again. This in turn will weaken the indices.
-
Trades must be executed in small volumes due to the higher volatility expected. Trade fewer counters and conserve cash for future opportunities.
-
Standby for fresh recommendations via SMS on a real - time basis.
- Have a profitable week.
- Vijay L Bhambwani
- Ceo :- Bsplindia.com
The author is a Mumbai based investment consultant and invites feedback at Vijay@BSPLindia.com and ( 022 ) 23438482 / 23400345.
SEBI disclosure :- The author has no positions in any securities mentioned above.
- While all due care has been taken while in compiling the data enclosed herein, we cannot be held responsible for errors, if any, creeping in. Please consult an independent qualified investment advisor before taking investment decisions. This mail is not sent unsolicited, and only advisory in nature. We have accepted no consideration from any company mentioned above and recommend taking decisions on merits of the stocks from our viewpoint. This email is being sent to you as a paid subscriber. Please protect your interests and ours by not disclosing the contents to any un-authorised person/s
Legal notice :- The Professional Ticker Reader is a trademark of Bhambwani Securities (P) Ltd. and any un-authorised replication / duplication in part or full will be infringing our trademark and will result in legal action being enforced on the infringing persons / parties.

