Global market indices - weekly feature - April 03, 2005
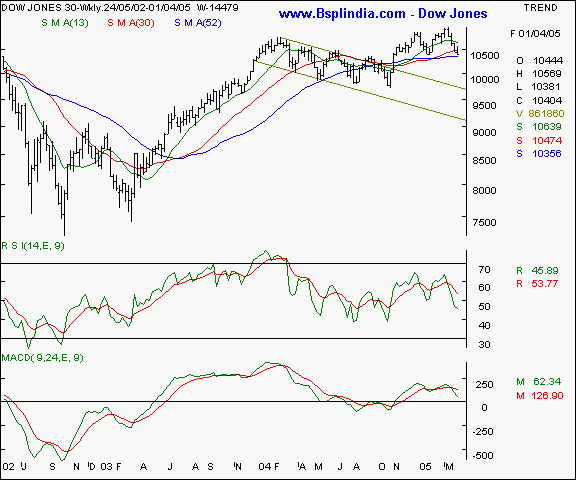
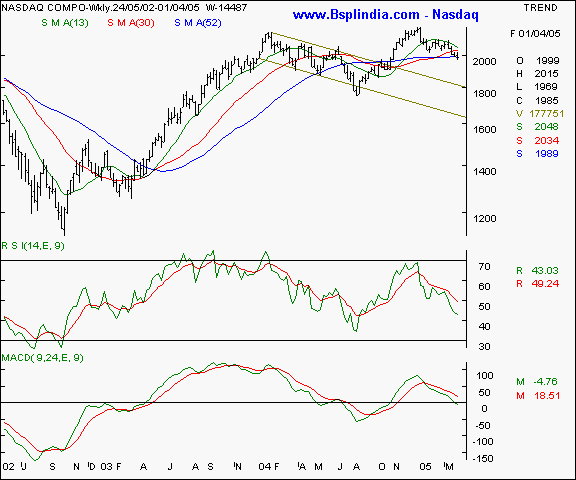
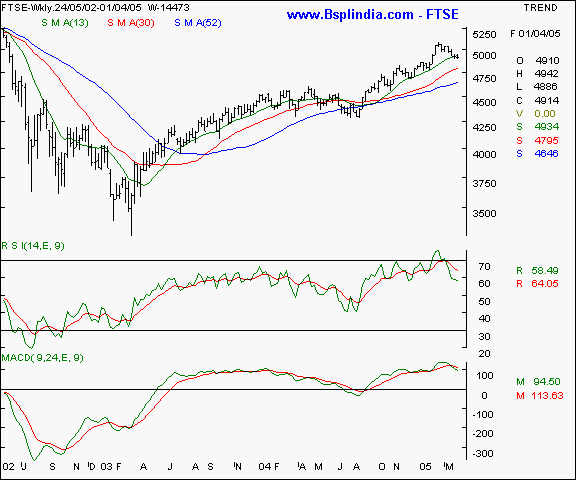
Dow Jones Industrial Average - this old economy index is showing a weakness on the weekly chart and is headed for the long term SMA's. The momentum oscillators are showing weakness and the 10370 levels are a critical support on this index, below which a steeper fall is likely. Upsides are likely to see resistance at the 10600 levels. Your call of action - this is a pure academic study. Nasdaq - this new economy index is also showing signs of weakness as the 52 week SMA has been violated on a closing basis. Resistance will be seen at the 2040 levels. Downsides can see 1944 levels. Your call of action - this is a pure academic study. FTSE - this UK index is likley to see some more pressure on the downsides and all rallies are likely to be mere pullbacks. A support at the 4800 levels is likely. A bullishness is likely only above the 5175 levels. Your call of action - this is a pure academic study. |
Your feedback is important ! Please click here to let us know your views. Click here to inform a friend about this page on our website.


