Global market indices - weekly feature - April 10, 2005
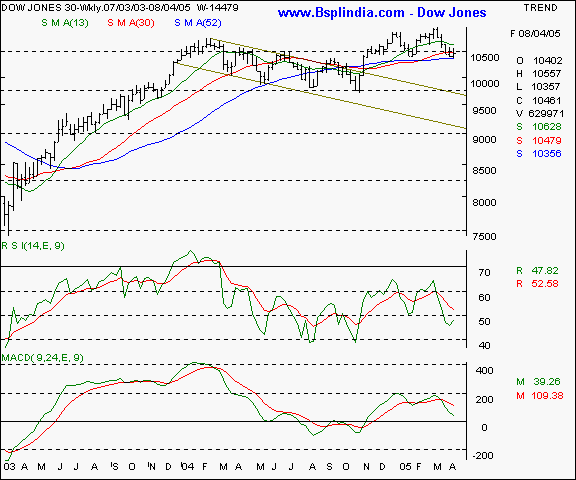
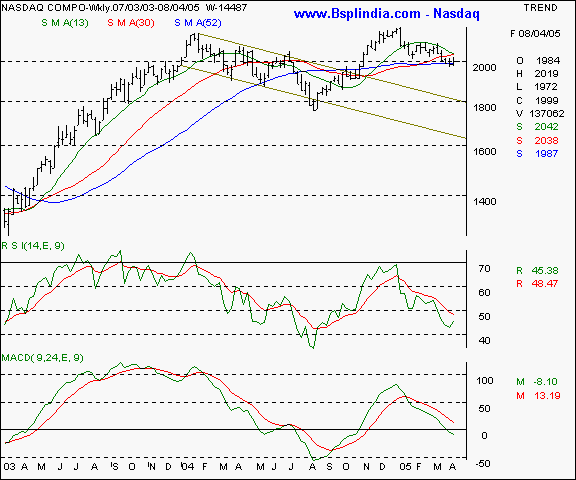
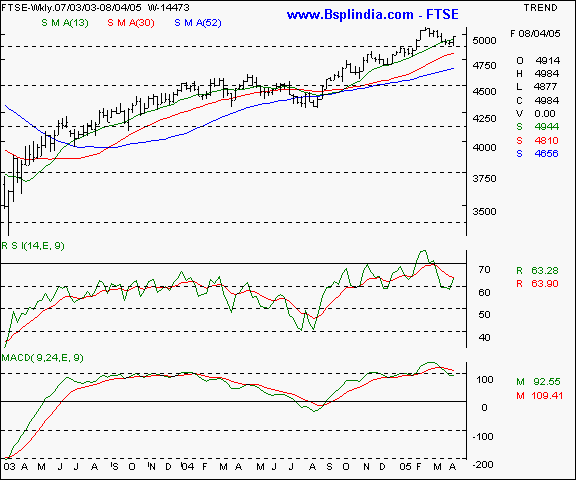
Dow Jones Industrial Average - this NYSE index has settled at the 52 week SMA as the downward pressure continues. Watch the 10350 levels for support in the immediate future and the 10625 levels for resistance in the coming week. There is a likelihood of a pullback in the near term. Your call of action - This is a pure academic study. Nasdaq - this showing a weaker trend as compared to the Dow and will have an impact on the domestic technology stocks as well. A consistent trade below the 1975 levels will be a confirmation of weakness and the Nasdaq can test the 1929 levels in that case. Upsides will see resistance at the 2045 levels in the near term. Your call of action - this is a pure academic study. FTSE - this UK index is showing relative out-performance in the near term as compared to the US indices. Ample support exists at the 4850 levels and resistance is likely at the 5120 levels in the coming week. Your call of action - this is a pure academic study. |
Your feedback is important ! Please click here to let us know your views. Click here to inform a friend about this page on our website.


