Global market indices - weekly feature - April 18, 2005
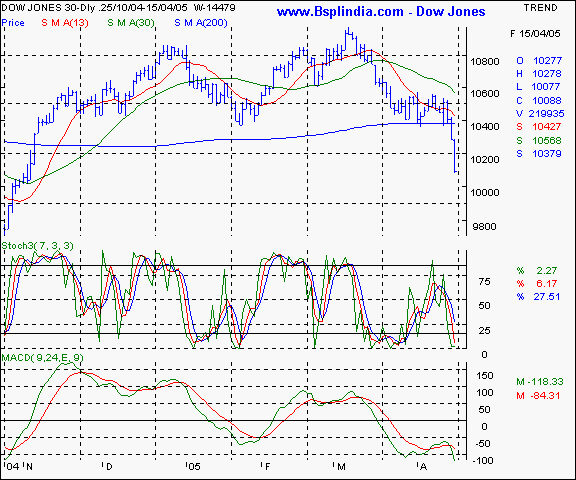
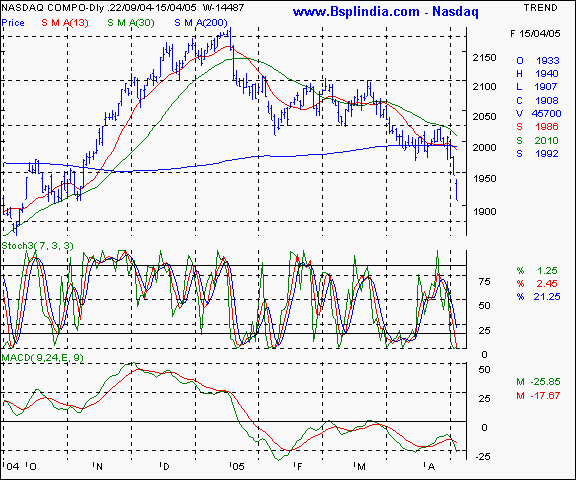
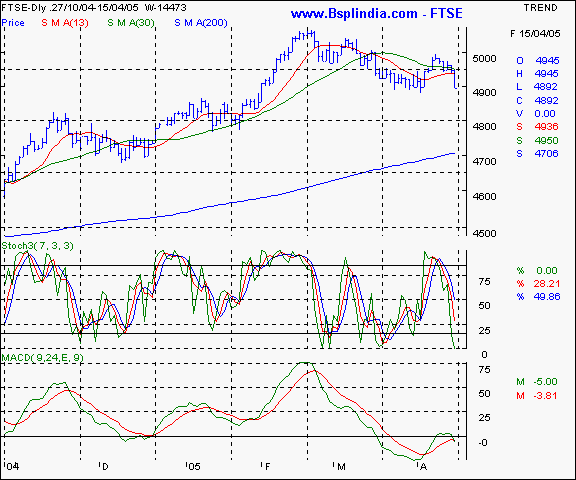
Dow Jones Industrial Average - this NYSE index is at it's lowest in 5 months and further weakness is in the offing as profit warnings and economic data start trickling in. The 200 day SMA has been violated and the 10350 levels are now a formidable short term resistance. The Dow is likely to test the 9888 levels in the coming days. Your call of action - this is a pure academic study. Nasdaq - this technology / biotech index has shown a sharp fall in tandem with the Dow Jones and is headed for the sub 1850 levels. Similar to the Dow, the 200 day SMA has been violated and will act as a barrier on the upsides. Your call of action - this is a pure academic study. FTSE - this US index has shown higher relative strength as compared to the US indices and we expect minor support at the 4810 levels. Upsides will see resistance at the 4955 levels and the chances of 4800 in the short term are fair. Your call of action - this is a pure academic study. |
Your feedback is important ! Please click here to let us know your views. Click here to inform a friend about this page on our website.


