Global market indices - weekly feature - April 24, 2005
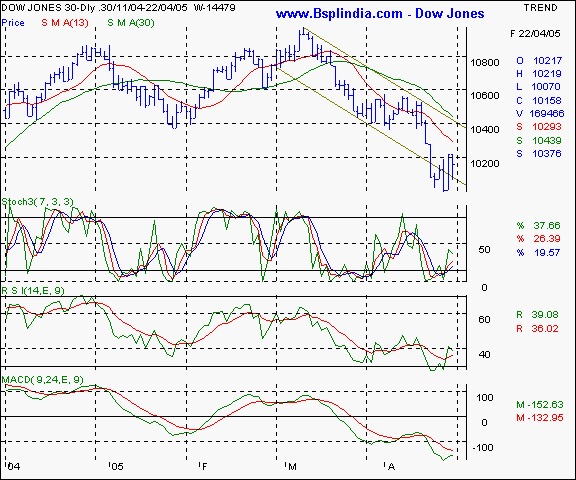
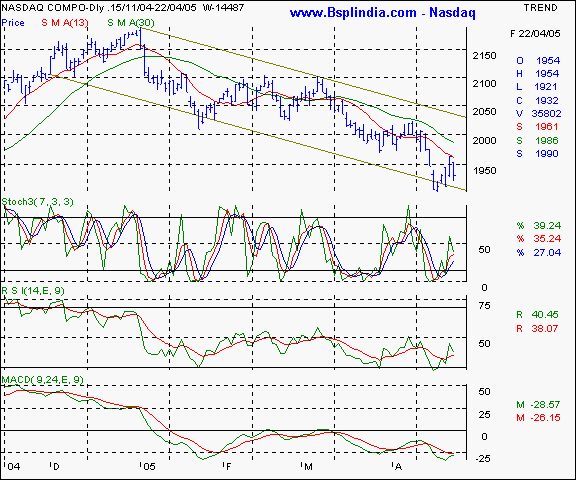
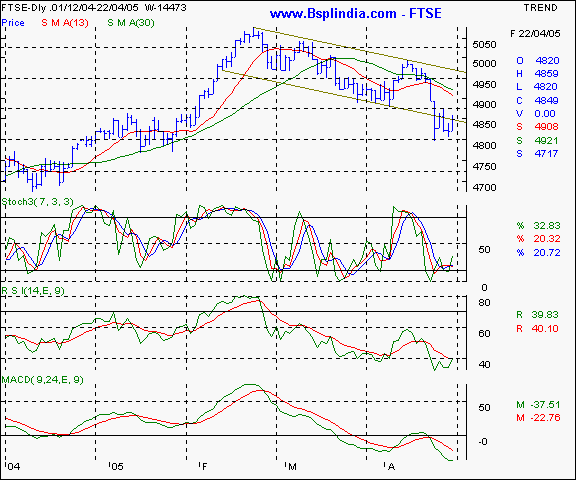
Dow Jones Industrial Average - this NYSE index is moving in a downward sloping channel and encounters resistance at the 10,200 - 10260 range. Any re-test of the 10,000 levels will see a faster fall as the psychological level is also a major threshold for the bulls to watch. Your call of action - this is a pure academic study. Nasdaq - the Nasdaq is moving in the bearish channel and encounters resistance at the short term averages at the 1960 - 1980 levels. Any sustained upmove above this level will be sign of a short term rally to the 2030 mark ( low probability event ). A fall below the 1900 levels will be a sign of accelerated weakness. Your call of action - this is a pure academic study. FTSE - the FTSE like the US indices has traded within a channel and moved below the bearish channel to exhibit a weak chart pattern. The momentum oscillators are showing a possibility of a pullback and a corrective rally that could test the 4900 - 4915 levels. Watch the 4800 levels for support in the coming week. Your call of action - this is a pure academic study. |
Your feedback is important ! Please click here to let us know your views. Click here to inform a friend about this page on our website.


