Flavours of the week Aug 07, 2005
These are stocks that we expect to out-perform the markets. Cash and derivative strategies are advised thereon. Please stay online to enable loading of graphics from our servers. Please also read the trading tips section at the end of the newsletter.
|
Individual stocks. |
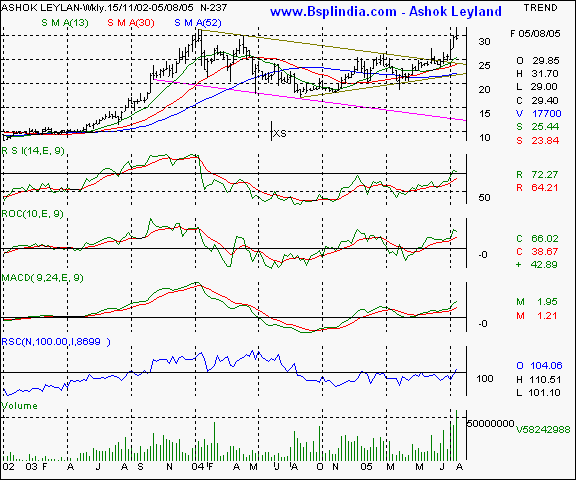
Ashok Leyland - This scrip was recommended vide our previous editions dtd June 05 & 11, July 02, 09, 23 and 30, 2005 and has achieved the desired results. Click here to view the previous recommendations. The noteworthy aspect about this chart pattern is the strong breakout to the previous top amidst very heavy volumes. The oscillators are supporting the rally and the relative strength is rising ( to understand the importance of relative strength, click here to view the tutorial ) and the scrip is turning into a strong market out-performer. We recommend a re-entry on major declines for the patient traders / investors.
Your call of action -
-
Investors / cash segment players - buy at lower levels of 28 and leave room for pyramid style averaging till the 26 mark. A stop loss at the 24 levels is advocated and a profit target of 34 is suggested in the medium term. Over a long term ( 1 year or more ) the stock has the potential to cross the 40 mark.
-
Aggressive F&O traders - Buy the September futures ( quoting at Re 0.70 premium to cash ) on declines to the 29 mark and average at the 27.75 levels. A stop loss at the 26.50 is suggested and a profit target of 34 is suggested in the medium term.
-
Derivatives contract size - Market lot = 9,550 shares. F&O margin = approx Rs 50,000 (subject to change daily )
Ashok Leyland I Arvind Mills I Corporation Bank I Guj Amb Cements I GSK Pharma I HPCL I Tata Power I TVS Motor I Wockhardt I BSE Sensex I Nifty I CNX-IT I Dow Jones I Nasdaq I FTSE I Top I Close window I Print page
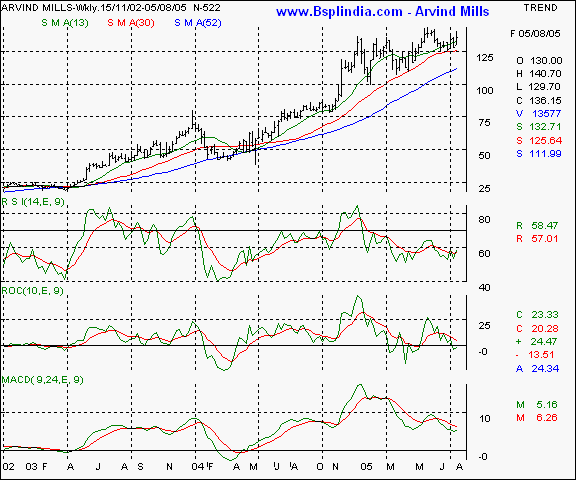
Arvind Mills - This scrip was recommended vide our earlier editions dtd Jan 15 & 21, Feb 19, May 28 and June 05 & 11, 2005. Click here to view the previous recommendations. The stock has historical resistance at the 142 levels and the price projection theories also suggest a termination of the intermediate uptrend at the 142 levels. Unless this hurdle is not surpassed convincingly, the scrip is unlikely to witness a secular and sustainable uptrend. We recommend a buy for the patient and disciplined investor only - that too after a confirmatory breakout.
Your call of action -
-
Investors / cash segment players - Buy above the 142 levels on a sustained closing basis and average in pyramid fashion till the 132 mark. A stop loss at the 125 levels is advocated and a price target of 155 is likely in the medium term. Long term players may expect significantly higher levels.
-
Aggressive F&O traders - Buy the August futures ( quoting at Re 1 premium to cash ) above a convincing close above the 143 levels and average lower till the 136 levels. Hold with a stoploss at the 131 levels. Expect to book profits at the 155 - 157 in the medium term.
-
Derivatives contract size - Market lot = 2,150 shares. F&O margin = approx Rs 52,000 (subject to change daily )
Ashok Leyland I Arvind Mills I Corporation Bank I Guj Amb Cements I GSK Pharma I HPCL I Tata Power I TVS Motor I Wockhardt I BSE Sensex I Nifty I CNX-IT I Dow Jones I Nasdaq I FTSE I Top I Close window I Print page
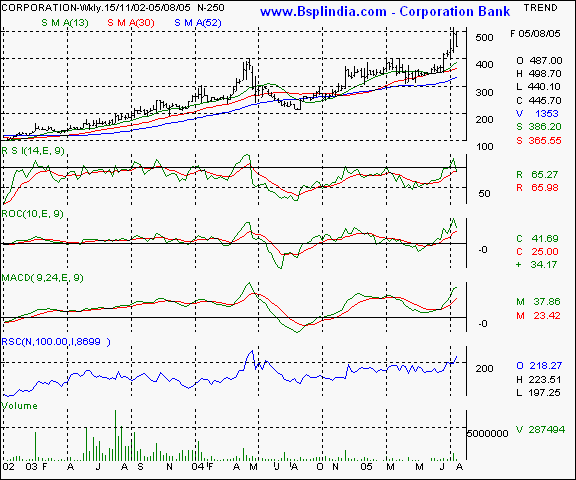
Corporation Bank - this scrip was recommended vide our earlier newsletter dtd July 30, 2005. Click here to view the previous recommendations. The scrip exhibits a strong rising tops and bottoms formation with convincing consistency and support from the oscillators. The relative strength ( to understand the importance of relative strength, click here to view the tutorial ) vis-a-vis the Nifty is high at 218 ( where 100 = base ) and traded volumes are picking up. We recommend a hold on existing long positions and a buy on declines.
Your call of action -
-
Investors / cash segment players - Buy on declines to the 440 levels and average downward in pyramid style till the 400 mark. Maintain a stop loss at the 365 levels and expect to book profits at the 625 levels in a years time frame.
-
Aggressive F&O traders - buy the August futures ( quoting at Rs 6 premium to cash ) on declines to the 440 levels and average lower till the 420 mark. A stop loss is advised at the 390 levels and profit booking is likely at the 475 is likely in the medium term.
-
Derivatives contract size - Market lot = 600 shares. F&O margin = approx Rs 50,000 (subject to change daily )
Ashok Leyland I Arvind Mills I Corporation Bank I Guj Amb Cements I GSK Pharma I HPCL I Tata Power I TVS Motor I Wockhardt I BSE Sensex I Nifty I CNX-IT I Dow Jones I Nasdaq I FTSE I Top I Close window I Print page
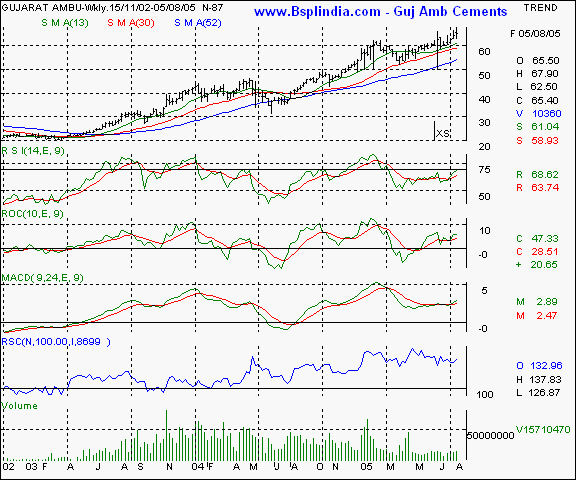
Gujarat Ambuja Cements - this scrip was recommended vide our edition dtd. June 06 and July 30, 2005. Click here to view the previous recommendations. The scrip is currently in the second leg of it's upmove and shows a high relative strength ( to understand the importance of relative strength, click here to view the tutorial ) of 133 vis-a-vis the Nifty ( where 100 = base ). The upmove is supported by the oscillators and rising moving averages. We recommend a buy.
Your call of action -
-
Investors / cash segment players - Buy the scrip at current levels and leave room for downward averaging till the 61 levels. Maintain a stop loss at the 57 and a target of 74 in the medium term and 82 in the long term.
-
Aggressive F&O traders - buy the Aug futures at the 64 levels and average till the 62 mark. A stop loss is advocated at the 59 levels and profit taking is suggested at the 72 - 74 levels in the medium term.
-
Derivatives contract size - Market lot = 4,125 shares. F&O margin = approx Rs 44,000 (subject to change daily )
Ashok Leyland I Arvind Mills I Corporation Bank I Guj Amb Cements I GSK Pharma I HPCL I Tata Power I TVS Motor I Wockhardt I BSE Sensex I Nifty I CNX-IT I Dow Jones I Nasdaq I FTSE I Top I Close window I Print page
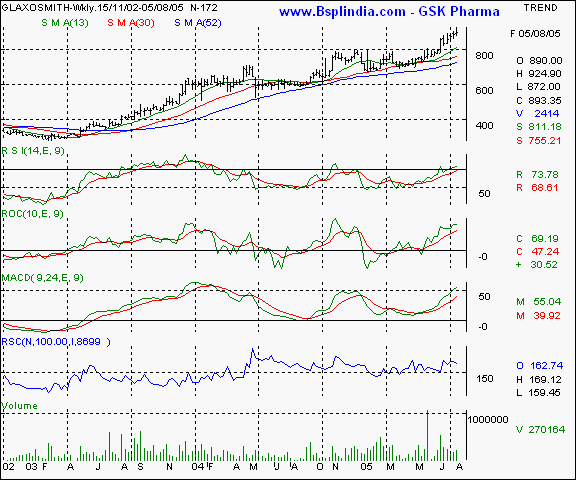
GSK Pharma - this scrip has been recommended earlier vide our edition dtd. Jan 16 & 30, June 26, July 02, 09 and 16 & 30, 2005 the stock has rewarded bulls handsomely. Click here to view the previous recommendations. The scrip is approaching it's all time highs and is showing signs of classic bullishness. The oscillators are rising and the traded volumes are improving. The relative strength ( to understand the importance of relative strength, click here to view the tutorial ) is high at 163 vis-a-vis the Nifty ( where 100 = base ) and the outlook remains bullish. We recommend a buy on all major declines.
Your call of action -
-
Investors / cash segment players - buy on major declines to the 870 levels and average in pyramid fashion till the 830 mark. A stop loss is advocated at the 800 mark and a profit target of 1040 is suggested.
-
Aggressive F&O traders - buy the August futures ( quoting at Rs 7 premium to cash ) at lower levels of 875 and average lower till the 855 mark. Maintain a stop loss at the 830 levels and a profit target of 935 in the medium term.
-
Derivatives contract size - Market lot = 300 shares. F&O margin = approx Rs 43,000 (subject to change daily )
Ashok Leyland I Arvind Mills I Corporation Bank I Guj Amb Cements I GSK Pharma I HPCL I Tata Power I TVS Motor I Wockhardt I BSE Sensex I Nifty I CNX-IT I Dow Jones I Nasdaq I FTSE I Top I Close window I Print page
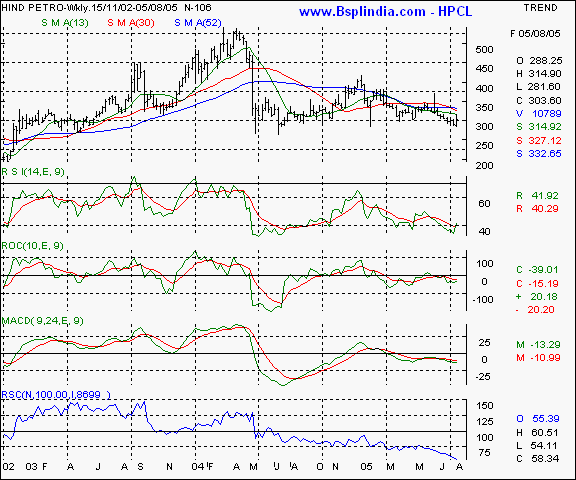
HPCL - this petroleum refining and marketing PSU major has been recommended vide our earlier editions dtd Jan 16, Mar 13 & 26, April 03 & 10, June 25, July 02, 09, 16 and 30, 2005 and has performed as per our bearish expectations. Click here to view the previous recommendations. The fortunes of refining counters are inversely linked to the international crude oil prices and same are rising now. The rally in the previous week has been news driven as the govt contemplates issuing bonds to bridge the gap in the oil pool deficit account. Past measures of similar nature have failed to yield desired results and the pullback is likely to terminate at higher levels. The oscillators remain in the sell mode and relative strength ( to understand the importance of relative strength, click here to view the tutorial ) has fallen sharply. We feel the 320 levels will be a formidable resistance and short sales should be initiated at those levels.
Your call of action -
-
Investors / cash segment players - n/a.
-
Aggressive F&O traders - sell the September futures ( quoting at Rs 6 discount to cash ) at the 314 levels and hold with a stop loss at the 322 levels. Expect to book profits at the 288 levels in the medium term.
-
Derivatives contract size - Market lot = 650 shares. F&O margin = approx Rs 32,000 (subject to change daily )
Ashok Leyland I Arvind Mills I Corporation Bank I Guj Amb Cements I GSK Pharma I HPCL I Tata Power I TVS Motor I Wockhardt I BSE Sensex I Nifty I CNX-IT I Dow Jones I Nasdaq I FTSE I Top I Close window I Print page
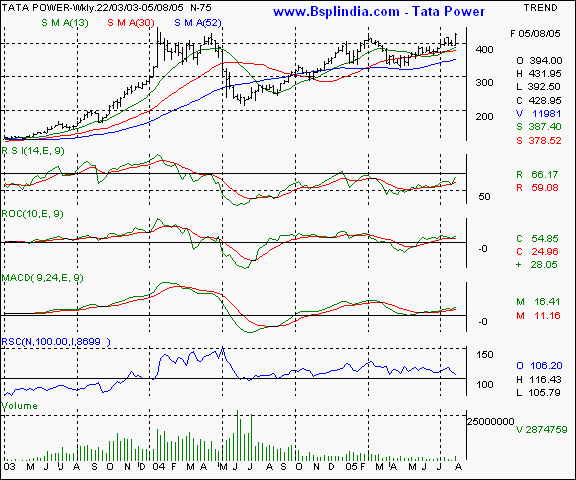
Tata Power - This scrip was recommended vide our earlier editions dtd Jan 15 & 21, Feb 5 & 19, March 25 and April 16, 2005. Click here to view the previous recommendations. The stock has a lot going for it as the 440 triple top is being approached amidst a bullish market outlook. The formation is also an inverted head and shoulder but will be confirmed only after a breakout above the 445 levels with high volumes. The oscillators are supporting the rally and the traded volumes are rising. The relative strength ( to understand the importance of relative strength, click here to view the tutorial ) is marginally higher than the Nifty at 106 ( where 100 = base ). A buy is recommended for the long term investor.
Your call of action -
-
Investors / cash segment players - buy above a convincing breakout above the 445 mark with higher volumes. Leave room for averaging till the 400 mark and a stop loss at the 382 levels. Expect to book profits at the 575 + levels in 18 - 24 month time frame.
-
Aggressive F&O traders - Buy the August futures ( quoting at Rs 3 premium to cash ) above the 448 levels and average till the 412 levels. A stop loss at the 400 mark is suggested and a profit target of 475 - 480 in the medium term.
-
Derivatives contract size - Market lot = 800 shares. F&O margin = approx Rs 52,000 (subject to change daily )
Ashok Leyland I Arvind Mills I Corporation Bank I Guj Amb Cements I GSK Pharma I HPCL I Tata Power I TVS Motor I Wockhardt I BSE Sensex I Nifty I CNX-IT I Dow Jones I Nasdaq I FTSE I Top I Close window I Print page
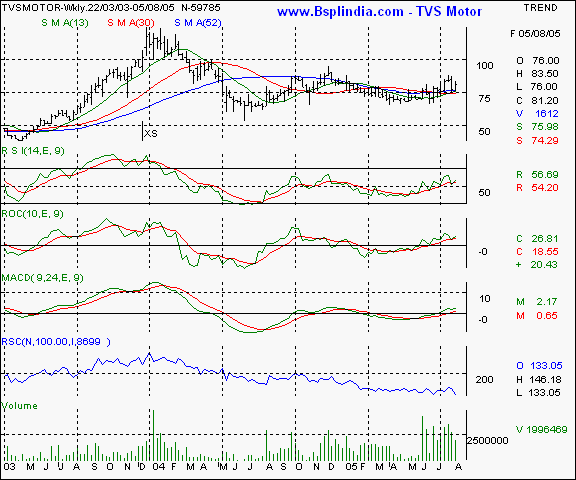
TVS Motor - This scrip was recommended vide our earlier editions dtd July 02 and 16, 2005. Click here to view the previous recommendations. The scrip is attempting to turnaround as the chart pattern suggests a rounding bottom which will be confirmed once the scrip starts to trade continuously above the 84 levels. The rally is supported by oscillators and the traded volumes have risen. The relative strength ( to understand the importance of relative strength, click here to view the tutorial ) vis-a-vis the Nifty is high at 133 ( where 100 = base ). We recommend a buy subject to a confirmatory rally.
Your call of action -
-
Investors / cash segment players - buy above the 84 levels and hold with a stop loss at the 74 mark. Expect to book profits at the 94 levels in the medium term and 100 + levels in the long term.
-
Aggressive F&O traders - buy the August futures above the 84 levels and hold with a stop loss at the 76 mark. Expect to book profits at the 94 levels in the medium term.
-
Derivatives contract size - Market lot = 825 shares. F&O margin = approx Rs 70,000 (subject to change daily )
Ashok Leyland I Arvind Mills I Corporation Bank I Guj Amb Cements I GSK Pharma I HPCL I Tata Power I TVS Motor I Wockhardt I BSE Sensex I Nifty I CNX-IT I Dow Jones I Nasdaq I FTSE I Top I Close window I Print page
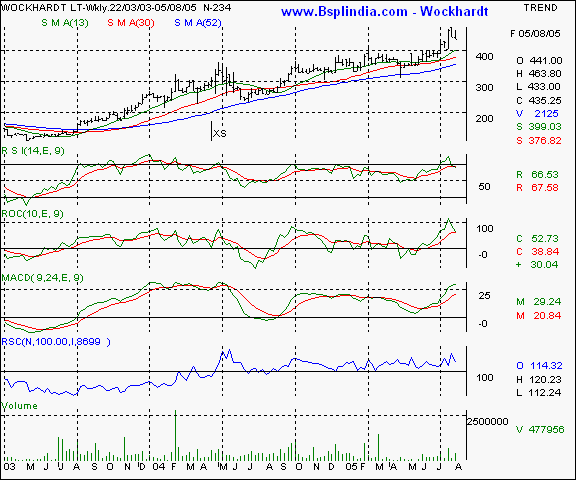
Wockhardt - This scrip was recommended vide our earlier editions dtd July 23 and 30, 2005. Click here to view the previous recommendations. The scrip is in the second leg of the upmove and needs to see higher volumes in order to rope in retail participation. The oscillators are supporting the upmove and the relative strength ( to understand the importance of relative strength, click here to view the tutorial ) is high at 114 vis-a-vis the Nifty ( where 100 = base ). We advocate buying on all major declines for the discerning long term investor.
Your call of action -
-
Investors / cash segment players - buy on declines to the 425 levels and keep room for pyramid averaging till the 400 mark. Maintain a stop loss at the 380 mark and expect to book profits at the 500 + levels in the medium term. Long term investors may hold for bigger gains.
-
Aggressive F&O traders - Buy the August futures ( quoting at Rs 4 premium to cash ) at lower levels of 425 and hold with a stop loss at the 410 mark. Expect profit taking at the 465 - 470 levels in the medium term.
-
Derivatives contract size - Market lot = 600 shares. F&O margin = approx Rs 44,000 (subject to change daily )
Ashok Leyland I Arvind Mills I Corporation Bank I Guj Amb Cements I GSK Pharma I HPCL I Tata Power I TVS Motor I Wockhardt I BSE Sensex I Nifty I CNX-IT I Dow Jones I Nasdaq I FTSE I Top I Close window I Print page
|
Indices - domestic |
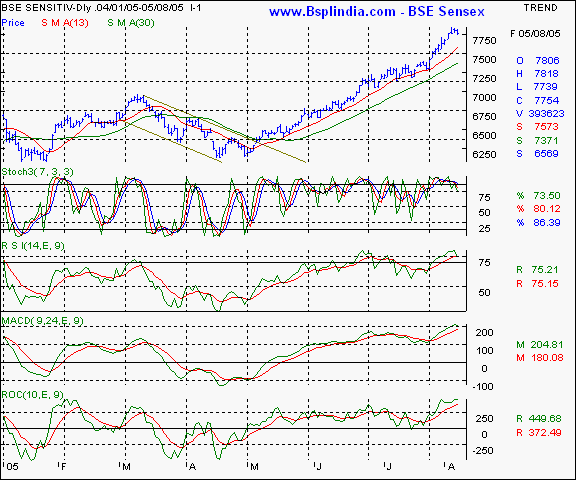
BSE Sensex - this index is in the correction mode as the 7800 levels are proving to be a difficult milestone to hold. The momentum oscillators are showing signs of negative divergence and a corrective fall may ensue. Lower levels will see support at the 7610 levels in the coming week. The upsides are likely to be capped at the 7864 levels.
Your call of action - Since the Sensex futures are not very liquid, we suggest trading the Nifty 50 instead.
Ashok Leyland I Arvind Mills I Corporation Bank I Guj Amb Cements I GSK Pharma I HPCL I Tata Power I TVS Motor I Wockhardt I BSE Sensex I Nifty I CNX-IT I Dow Jones I Nasdaq I FTSE I Top I Close window I Print page
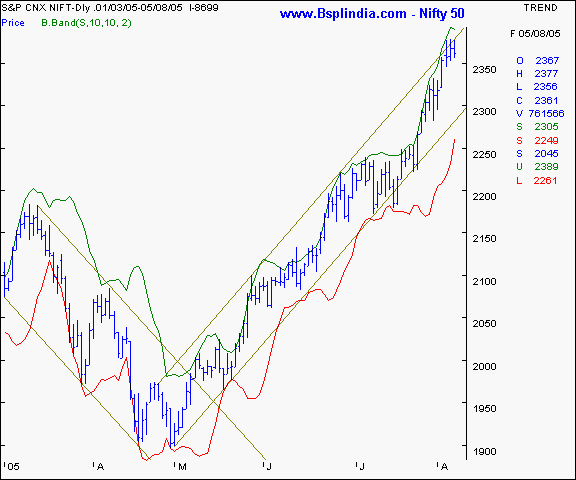
Nifty 50 - this index is showing signs of topping out as the momentum oscillators show signs of negative divergence, the scrip itself shows multiple resistance at the 2377 levels. The bollinger band resistance at the 2389 levels is likely to be a formidable hurdle for now. We feel the fall should see support emerging at the 2339 and the 2322 levels in the absolute short term.
Your call of action - our investors would have initiated short sales at higher levels as per our sms notification. Hold these short positions and add on 1 % advances till the 2300 levels. Covering is likely at the 2340 levels.
Ashok Leyland I Arvind Mills I Corporation Bank I Guj Amb Cements I GSK Pharma I HPCL I Tata Power I TVS Motor I Wockhardt I BSE Sensex I Nifty I CNX-IT I Dow Jones I Nasdaq I FTSE I Top I Close window I Print page
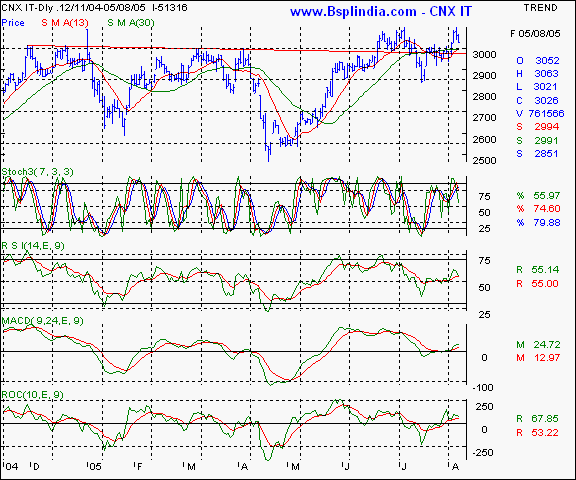
CNX IT - this index was advocated to remain positive above the 3000 mark and is managing to hold this level for now. We feel the index is unlikely to out-perform the markets in the near term and unless the 3085 levels are surpassed on a continous closing basis, a fresh upmove is unlikely.
Your call of action - Since the CNX IT futures are not very liquid, we suggest trading the Nifty 50 instead.
Ashok Leyland I Arvind Mills I Corporation Bank I Guj Amb Cements I GSK Pharma I HPCL I Tata Power I TVS Motor I Wockhardt I BSE Sensex I Nifty I CNX-IT I Dow Jones I Nasdaq I FTSE I Top I Close window I Print page
|
Indices - international |
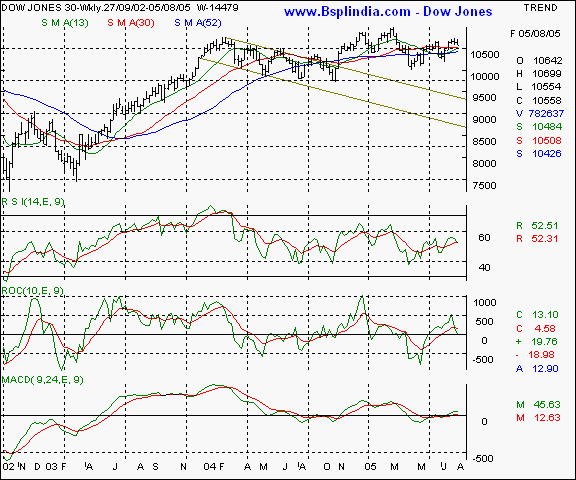
Dow Jones Industrial Average - this index is running into profit taking pressures at the 10700 levels and this psychological level is likely to be the hurdle for now. The 10445 levels are likely to be the immediate support to watch out for. The outlook is cautious for the coming week.
Your call of action - this is a pure academic study.
Ashok Leyland I Arvind Mills I Corporation Bank I Guj Amb Cements I GSK Pharma I HPCL I Tata Power I TVS Motor I Wockhardt I BSE Sensex I Nifty I CNX-IT I Dow Jones I Nasdaq I FTSE I Top I Close window I Print page
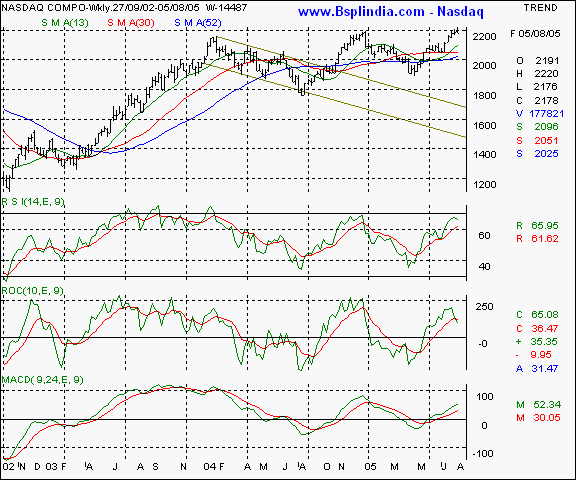
Nasdaq - the Nasdaq has managed to pierce the 2200 levels on an intra-week basis and closed below it. A continuous close above this level will see an accelerated upmove and we advocate a wait and watch approach till that occurs. Lower levels will see support at the 2128 mark.
Your call of action - this is a pure academic study.
Ashok Leyland I Arvind Mills I Corporation Bank I Guj Amb Cements I GSK Pharma I HPCL I Tata Power I TVS Motor I Wockhardt I BSE Sensex I Nifty I CNX-IT I Dow Jones I Nasdaq I FTSE I Top I Close window I Print page
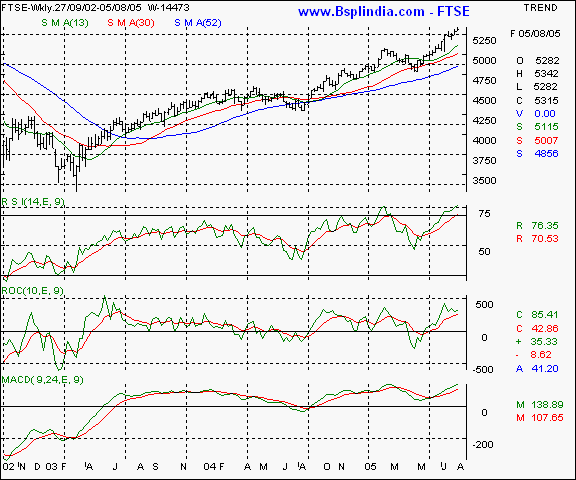
FTSE - this UK index is showing signs of out-performing the US markets and is trading at over 3 year highs. The immediate support is at the 5220 levels and 5450 levels will be the resistance to watch out for.
Your call of action - this is a pure academic study.
Ashok Leyland I Arvind Mills I Corporation Bank I Guj Amb Cements I GSK Pharma I HPCL I Tata Power I TVS Motor I Wockhardt I BSE Sensex I Nifty I CNX-IT I Dow Jones I Nasdaq I FTSE I Top I Close window I Print page
|
Trading tips for the week |
-
The put / call ratio is climbing and is currently at the 0.27 : 1 levels and the outstanding positions in the derivatives segment have shown a quantitative increase. The FII investments are continuing steadily.
-
There is offloading at higher levels in stock futures. That indicates a cautious approach as long positions in individual stocks is being hedged by Nifty shorts.
-
Trades must be executed in small volumes due to the higher volatility expected. Trade fewer counters and conserve cash for future opportunities.
-
Standby for fresh recommendations via SMS on a real - time basis.
- Have a profitable week.
- Vijay L Bhambwani
- Ceo :- Bsplindia.com
The author is a Mumbai based investment consultant and invites feedback at Vijay@BSPLindia.com and ( 022 ) 23438482 / 23400345.
SEBI disclosure :- The author has no positions in any securities mentioned above.
- While all due care has been taken while in compiling the data enclosed herein, we cannot be held responsible for errors, if any, creeping in. Please consult an independent qualified investment advisor before taking investment decisions. This mail is not sent unsolicited, and only advisory in nature. We have accepted no consideration from any company mentioned above and recommend taking decisions on merits of the stocks from our viewpoint. This email is being sent to you as a paid subscriber. Please protect your interests and ours by not disclosing the contents to any un-authorised person/s
Legal notice :- The Professional Ticker Reader is a trademark of Bhambwani Securities (P) Ltd. and any un-authorised replication / duplication in part or full will be infringing our trademark and will result in legal action being enforced on the infringing persons / parties.

