Dow
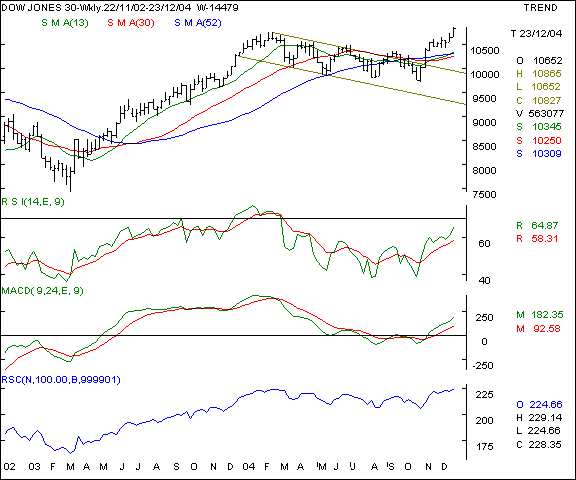
Jones Industrial Average - this US old economy index is
showing extreme strength as it breached a 3 1/2 year levels and closed at
a critical high which shows strength in then undertone. The chart shows an
inverted head & shoulder formation and a flag formation which is a sign of
strength. This index is likely to see the 11000 levels after the christmas
break is over.

Your
call of action - Since Indian
investors are not allowed to trade
in overseas markets, this is a pure
academic study.
Nasdaq
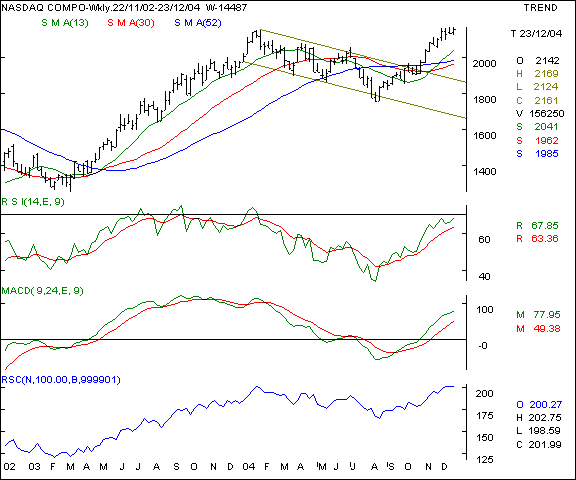
- the Nasdaq is making similar chart patterns like the Dow Joes, however
showing lower chartical strength. The 2170 levels need to be surpassed to
signal strength and the 2135 levels are an immediate floor price below
which the index should not fall.

Your
call of action - Since Indian investors are not
allowed to trade in overseas markets, this is a pure academic study.
FTSE
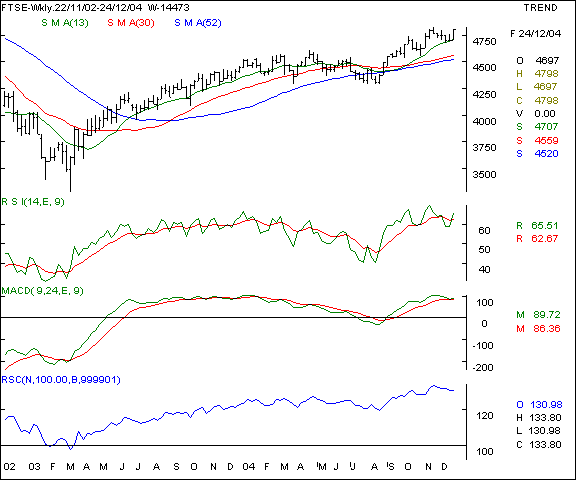
- this UK index is showing signs of strength as the index attempts to test
the previous top amidst the pre-christmas sentiments. This index needs to
trade consistently above the 4865 levels to signal bullishness and
maintain an upward trajectory. The 4725 levels will be a good support in
the coming week.

Your
call of action - Since Indian investors are not allowed to trade
in overseas markets, this is a pure
academic study.