- Your accurate, authentic and affordable guide to investing
Flavours of the week Feb 05, 2005
These are stocks that we expect to out-perform the markets. Cash and derivative strategies are advised thereon. Please stay online to enable loading of graphics from our servers. Please also read the trading tips section at the end of the newsletter.
|
Individual stocks. |
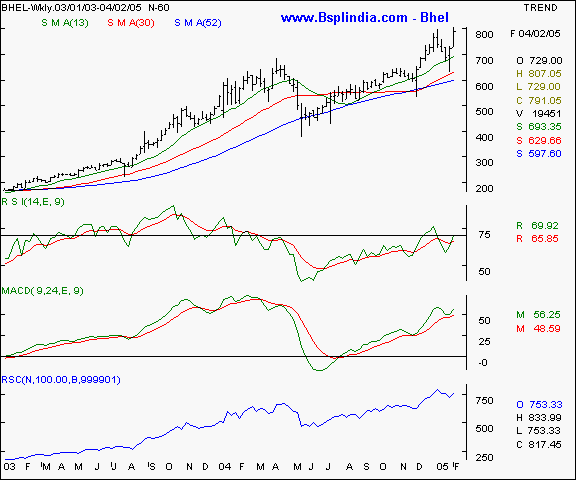
BHEL - This scrip was recommended vide our earlier editions dtd Sept 05, Oct 10, Dec 12, Dec 19 2004, Jan 09 & Jan 03 2005 and has been a superlative performer. Click here to view previous reports. The high relative strength of 753 levels is a confidence inspiring aspect of this price chart. The scrip shows a rising tops and bottoms formation and is typical of bull markets. The momentum oscillators are pointing towards further upmove being possible on the counter and the scrip itself is on the threshold of a breakout above the 807 levels into lifetime highs. We recommend a buy on declines for investors and above a confirmed breakout for traders.
Your call of action -
-
Investors / cash segment players - buy on declines to the 765 - 775 levels and hold with a stop loss at the 730 levels. Expect to book profits at the 825 mark in the medium term.
-
Aggressive F&O traders - Buy the Feb futures above the 810 mark and hold with a stop loss at the 803 levels. Expect profit taking at the 820 - 824 levels in a conducive market in the short / medium term.
-
Derivatives contract size - Market lot = 600 shares. F&O margin = approx Rs 81,000 (subject to change daily )
BHEL I Grasim I HDFC I ITC I Mah &Mah I NTPC I Raymond I Tata Tele I Tata Power I Tata Tea I BSE Sensex I Nifty I CNX-IT I Dow Jones I Nasdaq I FTSE I Top I Close window I Print page
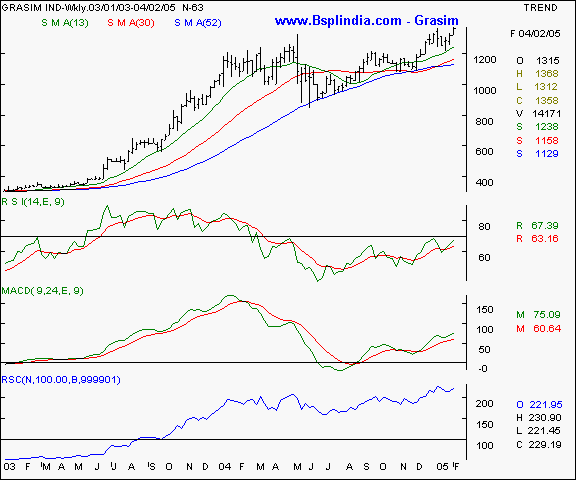
Grasim - this scrip was recommended vide our earlier editions dtd Oct 31, Dec 05, Dec 19, 2004 and Jan 30, 2005 Click here to view previous reports and has performed as per our expectations. The scrip is on the threshold of a breakout and is exhibiting a strong chart pattern. The high relative strength of 222 is a comforting aspect as the scrip gears up to zoom into virgin territory once the 1368 levels are surpassed. The oscillators are supporting the upmove and technical traders may note the rising tops and bottoms formation in progress. We recommend a buy on the counter.
Your call of action -
-
Investors / cash segment players - Buy the scrip on minor declines to the 1335 - 1345 levels and hold with a liberal stop loss at the 1310 levels. Expect to book profits at the 1450 levels in a conducive market in the medium term.
-
Aggressive F&O traders - Buy the Feb futures above the 1369 levels and hold with stop loss at the 1345 levels. Expect profit taking at the 1390 - 1395 in the near term and 1410 - 1415 in the medium term in a conducive market.
-
Derivatives contract size - Market lot = 350 shares. F&O margin = approx Rs 75,000 (subject to change daily )
BHEL I Grasim I HDFC I ITC I Mah &Mah I NTPC I Raymond I Tata Tele I Tata Power I Tata Tea I BSE Sensex I Nifty I CNX-IT I Dow Jones I Nasdaq I FTSE I Top I Close window I Print page
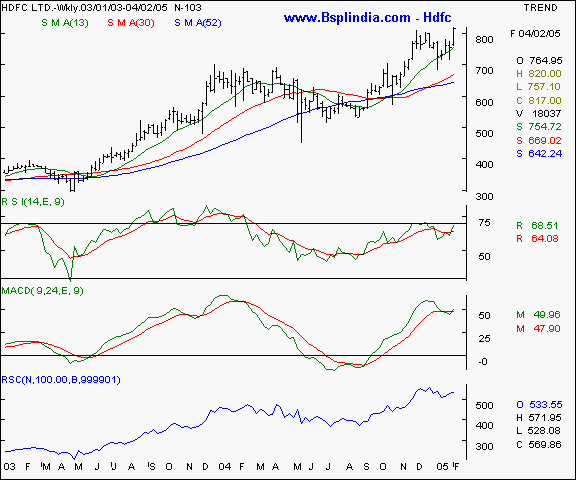
HDFC Ltd - this scrip was recommended vide our earlier newsletter dtd Nov 21 and has been a market out-performer. Click here to view previous reports. The most noticeable aspect is the rising tops and bottoms formation on the charts and the scrip hitting a new lifetime high. Technical traders will note the extremely high relative strength of 535 ( 100 = base ). The scrip is a pre-budget favourite amongst the institutional players and is for the patient and discerning investor / trader only. We recommend a buy.
Your call of action -
-
Investors / cash segment players - buy on declines to the 775 - 790 levels and hold with a stop loss at the 745 levels. Expect to book profits at the 875 + levels in the short / medium term in a conducive market.
-
Aggressive F&O traders - Buy the Feb futures in minimal lots at the 805 - 810 levels and hold with a stop loss at the 767 levels. Expect profit taking at the 850 in the short term and 870 in the medium term in a conducive market.
-
Derivatives contract size - Market lot = 600 shares. F&O margin = approx Rs 75,000 (subject to change daily )
BHEL I Grasim I HDFC I ITC I Mah &Mah I NTPC I Raymond I Tata Tele I Tata Power I Tata Tea I BSE Sensex I Nifty I CNX-IT I Dow Jones I Nasdaq I FTSE I Top I Close window I Print page
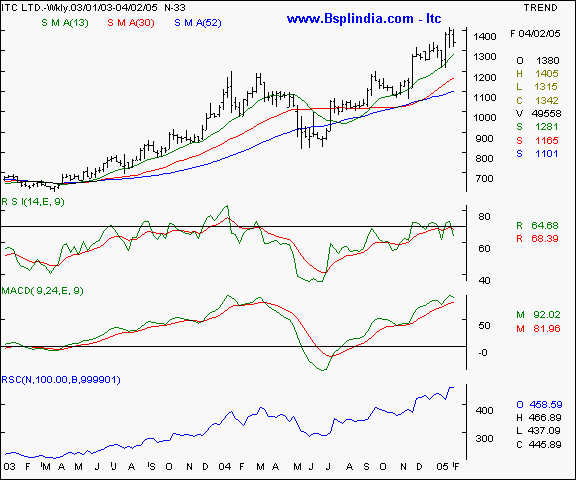
ITC - this FMCG major was recommended vide our editions dtd Sept 12, 2004 and has performed exceedingly well. Click here to view previous reports. The 1400 + levels are witnessing selling pressure as the scrip enters a new bull zone and has encountered adverse newsflow. We remain positive on the counter inspite of the negative newsflow and recommend a buy on declines. Technical traders may please note the high relative strength of 458 and a rising tops and bottoms formation on the charts. The 13 week SMA has been an effective support and we advocate a buy near those levels.
Your call of action -
-
Investors / cash segment players - Buy on declines to the 1280 - 1300 levels and hold with a stop loss at the 1215 levels. Expect to book profits at the 1400 + levels in a conducive market in the medium term. Longer term players are likely to achieve higher levels.
-
Aggressive F&O traders - Buy the February futures on declines to the 1310 levels and hold with a stop loss at the 1248 levels. Expect to book profits at the 1370 - 1385 levels in a conducive market in the medium term. Since the price swings expected are large, trade small lots only.
-
Derivatives contract size - Market lot = 300 shares. F&O margin = approx Rs 73,000 (subject to change daily )
BHEL I Grasim I HDFC I ITC I Mah &Mah I NTPC I Raymond I Tata Tele I Tata Power I Tata Tea I BSE Sensex I Nifty I CNX-IT I Dow Jones I Nasdaq I FTSE I Top I Close window I Print page
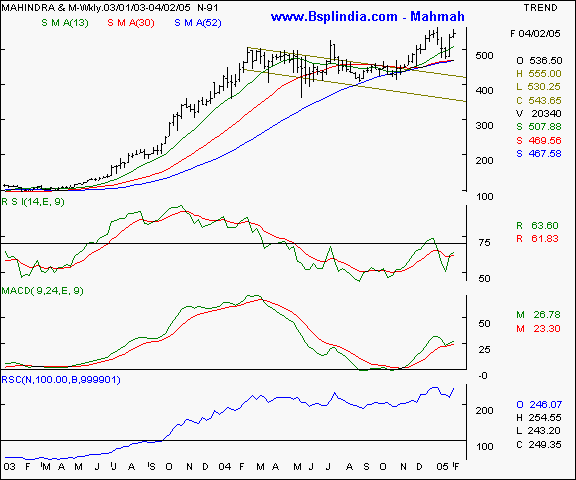
Mah & Mah - this scrip has been one of the most prolific recommendations from us and was recommended vide our editions dtd Sept 19, Nov 14, Nov 26, Dec 05, Dec 12, Dec 19, Dec 26 2004, Jan 01, Jan 09 and Jan 22, 2005. Click here to view previous reports. We are enthused by the high relative strength and the bullish chart pattern which shows a rising tops and bottoms formation. Note how the 52 week SMA is a solid support for the scrip and the high relative strength. The high oscillators are pointing towards bullishness and above 565 - 568, the scrip enters a new trading zone and a lifetime high. This scrip is another pre budget favourite amongst the institutional players. We recommend a buy.
Your call of action -
-
Investors / cash segment players - buy on declines to the 535 levels and hold with a stop loss at the 515 levels. Expect to book profits at the 575 - 585 levels in the short / medium term in a conducive market. Over the longer period, we expect 600 + levels.
-
Aggressive F&O traders - Buy the February futures at the 540 levels and hold with a stop loss at the 528 levels. Expect profit taking at the 570 - 575 levels in the short / medium term in a conducive market.
-
Derivatives contract size - Market lot = 625 shares. F&O margin = approx Rs 58,000 (subject to change daily )
BHEL I Grasim I HDFC I ITC I Mah &Mah I NTPC I Raymond I Tata Tele I Tata Power I Tata Tea I BSE Sensex I Nifty I CNX-IT I Dow Jones I Nasdaq I FTSE I Top I Close window I Print page
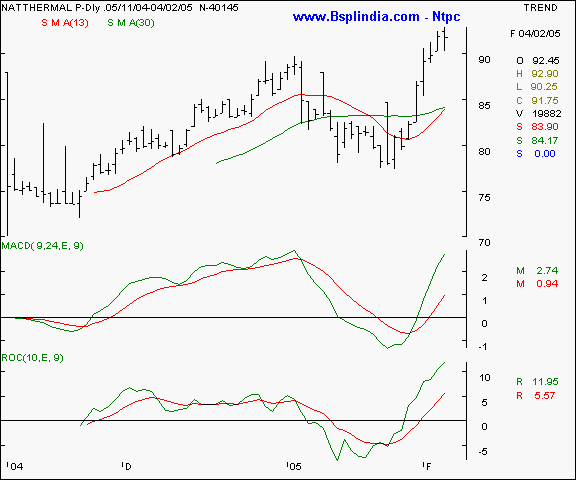
NTPC - this scrip was recommended at the 82 levels vide our earlier editions dtd Dec 26 2004, Jan 01, Jan 09 and Jan 30 2005. Click here to view previous reports. The scrip has returned a superlative performance and is nearly at it's all time highs. We expect a consolidation at these levels and even a minor fall is not ruled out. Buying recommended on declines for the returns conscious patient investors.
Your call of action -
-
Investors / cash segment players - Buy on declines to the 88 levels and hold with a stop loss at the 84 levels. Expect profit taking at the 98 levels in a conducive markets in the medium term. Over the longer term, we expect higher levels.
-
Aggressive F&O traders - Buy the February futures at the 88.50 - 89 levels and hold with a stop loss at the 85 levels. Expect profit taking at the 94 - 95 levels in the short / medium term in a conducive markets.
-
Derivatives contract size - Market lot = 3,250 shares. F&O margin = approx Rs 51,000 (subject to change daily )
BHEL I Grasim I HDFC I ITC I Mah &Mah I NTPC I Raymond I Tata Tele I Tata Power I Tata Tea I BSE Sensex I Nifty I CNX-IT I Dow Jones I Nasdaq I FTSE I Top I Close window I Print page
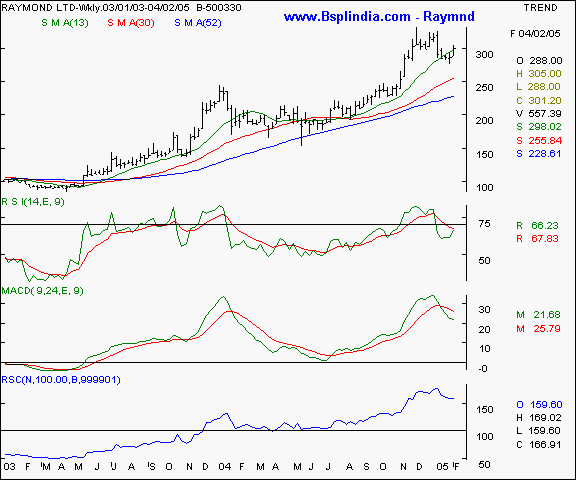
Raymonds Ltd - this scrip was recommended vide our earlier editions dtd Sept 19, Nov 21 and Nov 27, 2004. Click here to view previous reports. The scrip has seen a consolidation after a good run upwards and as we had predicted earlier, a fall has taken the scrip to sub 300 levels. As per our calculations, the correction is almost through and a buy is recommended for the patient delivery based investor with a 6 month perspective for good returns.
Your call of action -
-
Investors / cash segment players - buy at the 290 - 300 levels and hold with a stop loss at the 265 levels. Expect to book profits at the 375 levels in the short / medium term. Over a 6 month - 1 year period, we expect 400 + levels.
-
Aggressive F&O traders - f&o n/a.
-
Derivatives contract size - f&o n/a.
BHEL I Grasim I HDFC I ITC I Mah &Mah I NTPC I Raymond I Tata Tele I Tata Power I Tata Tea I BSE Sensex I Nifty I CNX-IT I Dow Jones I Nasdaq I FTSE I Top I Close window I Print page
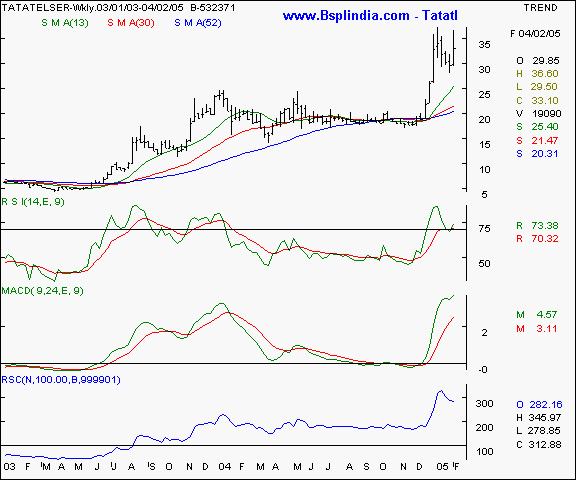
Tata Teleservices - this scrip was recommended at the 20 + levels vide our editions dtd Dec 12 and Dec 19 2004. Click here to view previous reports. Our earlier recommendations were at 14 - 16 levels in Dec 2003 and the scrip has paid handsome rewards to patient investors. After a consolidatory move, we feel the scrip is in for an upmove and recommend a buy. Technical traders may note the high relative strength of 282 ( where 282 is the base ).
Your call of action -
-
Investors / cash segment players - Buy at the 31 - 32 levels and hold with a stop loss at the 28 - 29 levels. Expect to book profits at the 38 - 40 levels in the short / medium term. Over the longer term time frame of 1 year, we expect even higher levels.
-
Aggressive F&O traders - f&o n/a.
-
Derivatives contract size - f&o n/a.
BHEL I Grasim I HDFC I ITC I Mah &Mah I NTPC I Raymond I Tata Tele I Tata Power I Tata Tea I BSE Sensex I Nifty I CNX-IT I Dow Jones I Nasdaq I FTSE I Top I Close window I Print page
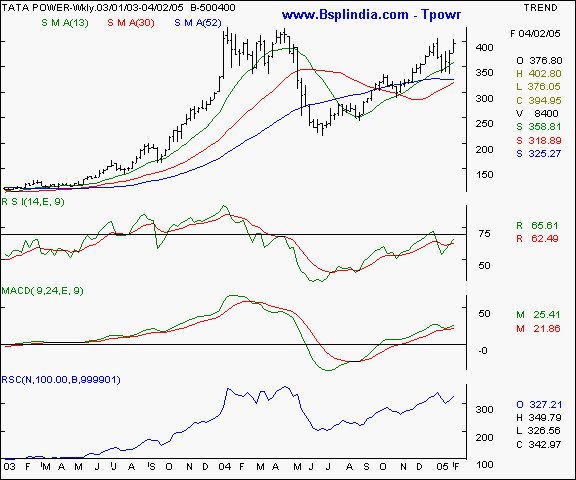
Tata Power - this scrip was recommended vide our earlier editions dtd Sept 12, Sept 26, Oct 03, Nov 14, Dec 12 2004, Jan 16 and Jan 22, 2005. Click here to view previous reports. The scrip is trading above a congestion level of 378 and is below another threshold level of 407 levels. Should it start trading convincingly above these levels, we expect the fresh upmove to take the scrip past the 425 levels. We recommend a buy.
Your call of action -
-
Investors / cash segment players - buy on declines to the 380 - 385 levels and hold with a stop loss at the 372 levels. Expect to book profits at the 400 - 415 levels in a conducive market in the medium term.
-
Aggressive F&O traders - buy the February futures above the 405 levels and hold with a stop loss at the 397 levels. Expect profit taking at the 415 - 420 levels in a conducive market in the short / medium term.
-
Derivatives contract size - Market lot = 800 shares. F&O margin = approx Rs 68,000 (subject to change daily )
BHEL I Grasim I HDFC I ITC I Mah &Mah I NTPC I Raymond I Tata Tele I Tata Power I Tata Tea I BSE Sensex I Nifty I CNX-IT I Dow Jones I Nasdaq I FTSE I Top I Close window I Print page
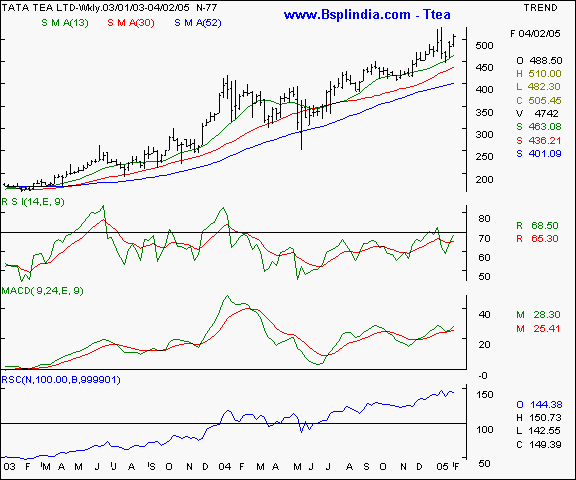
Tata Tea - this scrip was recommended vide our earlier editions dtd Oct 31, Nov 27, Dec 05, Dec 19 2004, Jan 09 and Jan 22, 2005. Click here to view previous reports. The scrip has been a strong market out-performer and has a high relative strength of 144. The scrip makes a rising tops and bottoms formation and is getting good support at the short / medium term moving averages. We recommend a buy in small lots as a pre-budget play.
Your call of action -
-
Investors / cash segment players - Buy on minor declines to the 480 - 485 levels and hold with a stop loss at the 460 mark. Expect to book profits at the 525 - 545 levels in a firm market in the short / medium term.
-
Aggressive F&O traders - Buy the February futures at the 500 - 505 levels and hold with a stop loss at the 492 levels. Expect profit taking at the 525 levels in a conducive market in the short term. Should the markets be exceptionally firm, expect 535 - 540 to be a possibility.
-
Derivatives contract size - Market lot = 550 shares. F&O margin = approx Rs 43,000 (subject to change daily )
BHEL I Grasim I HDFC I ITC I Mah &Mah I NTPC I Raymond I Tata Tele I Tata Power I Tata Tea I BSE Sensex I Nifty I CNX-IT I Dow Jones I Nasdaq I FTSE I Top I Close window I Print page
|
Indices - domestic |
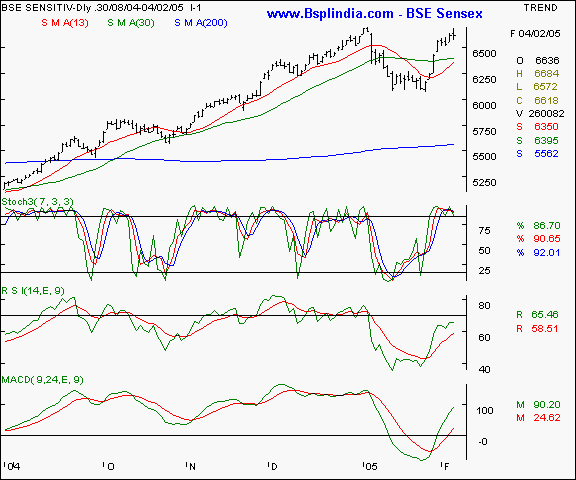
BSE Sensex - The sensex has managed to close higher on a week-on-week basis but below the all time highs. This week should see an upmove that may take the Sensex above the 6700 levels as the undertone remains positive and the chartical outlook remains bullish. We expect support at lower levels of 6488 and as long as the Sensex remains above this mark, expect bullishness. A crossover above the 6700 levels will see an accelerated upmove.
Your call of action - Since the Sensex futures are not very liquid, we suggest trading the Nifty 50 instead.
BHEL I Grasim I HDFC I ITC I Mah &Mah I NTPC I Raymond I Tata Tele I Tata Power I Tata Tea I BSE Sensex I Nifty I CNX-IT I Dow Jones I Nasdaq I FTSE I Top I Close window I Print page
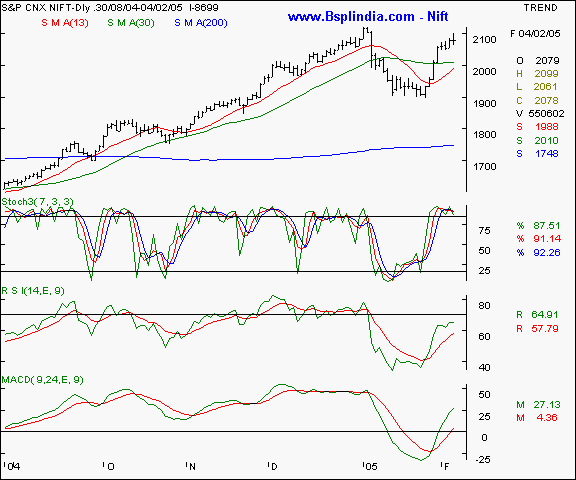
Nifty 50 - the Nifty has exhibited similar chart patterns like the Sensex and has been unable to surpass the previous highs. We expect immediate support at the 2064 levels and a strong intermediate support at the 2032 levels below which the index should not go in the coming weeks. One the previous top of 2120 is surpassed, expect a faster climb.
Your call of action - Buy the Nifty February futures at the 2080 - 2085 levels and hold with a stop loss at the 2069 levels. Expect profit taking at the 2105 - 2115 levels in the near term. Should the 2120 levels be surpassed convincingly, expect the 2145 levels to be the next short term target.
BHEL I Grasim I HDFC I ITC I Mah &Mah I NTPC I Raymond I Tata Tele I Tata Power I Tata Tea I BSE Sensex I Nifty I CNX-IT I Dow Jones I Nasdaq I FTSE I Top I Close window I Print page
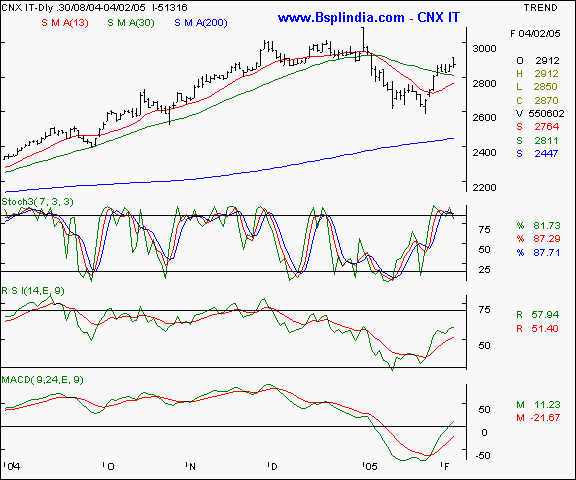
CNX IT - the IT index is showing signs of fatigue at higher levels as the 2900 levels are proving to be a formidable hurdle. Only above this level will be a change in outlook to the positive. We feel the 2788 levels should be watched keenly for signs of support and 2910 for resistance.
Your call of action - Since the CNX IT futures are not very liquid, we suggest trading the Nifty 50 instead.
BHEL I Grasim I HDFC I ITC I Mah &Mah I NTPC I Raymond I Tata Tele I Tata Power I Tata Tea I BSE Sensex I Nifty I CNX-IT I Dow Jones I Nasdaq I FTSE I Top I Close window I Print page
|
Indices - international |
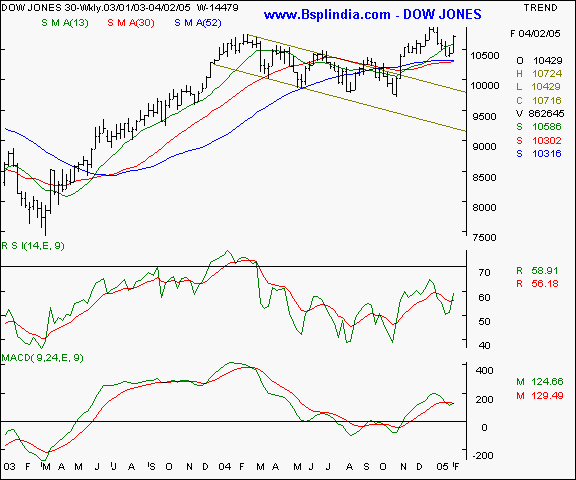
Dow Jones Industrial Average - this NYSE benchmark has risen for the second week running and has shown a strong surge. We expect resistance at the 10855 and a support at the 10625 in the coming week.
Your call of action - Since Indian investors are not allowed to trade in overseas markets, this is a pure academic study.
BHEL I Grasim I HDFC I ITC I Mah &Mah I NTPC I Raymond I Tata Tele I Tata Power I Tata Tea I BSE Sensex I Nifty I CNX-IT I Dow Jones I Nasdaq I FTSE I Top I Close window I Print page
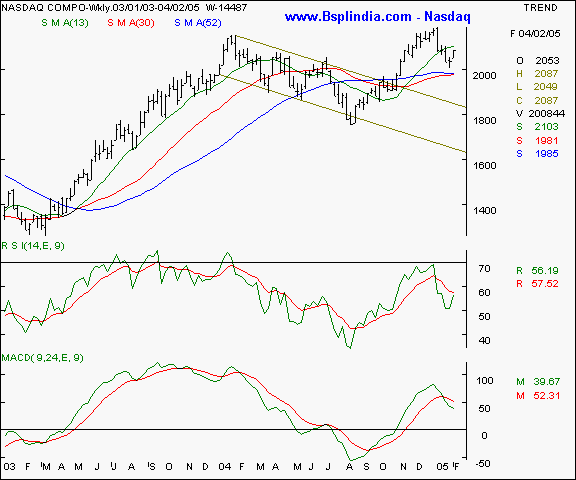
Nasdaq - This technology / biotech index has shown a rally but not of the same magnitude as the Dow Jones. Expect resistance at the 2118 levels and support at the 2036 levels in the coming days.
Your call of action - Since Indian investors are not allowed to trade in overseas markets, this is a pure academic study.
BHEL I Grasim I HDFC I ITC I Mah &Mah I NTPC I Raymond I Tata Tele I Tata Power I Tata Tea I BSE Sensex I Nifty I CNX-IT I Dow Jones I Nasdaq I FTSE I Top I Close window I Print page
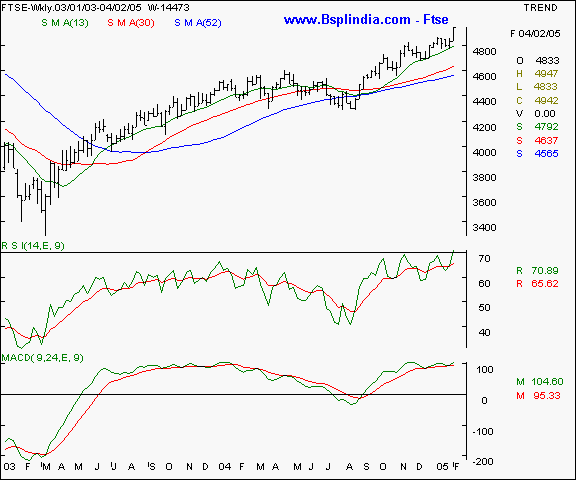
FTSE - This UK index has shown a higher relative strength as compared to the US indices and has surged past it's previous resistance levels to go in a new medium term highs. 4820 levels are a good base for now and 5080 will be a strong resistance in the short term.
Your call of action - Since Indian investors are not allowed to trade in overseas markets, this is a pure academic study.
BHEL I Grasim I HDFC I ITC I Mah &Mah I NTPC I Raymond I Tata Tele I Tata Power I Tata Tea I BSE Sensex I Nifty I CNX-IT I Dow Jones I Nasdaq I FTSE I Top I Close window I Print page
|
Trading tips for the week |
-
The put / call ratio is climbing and is currently at the 0.35 : 1 levels and the outstanding positions in the derivatives segment have shown a qualitative increase. The FII investments are continuing encouragingly.
-
There is buying at lower levels in stock futures. That indicates a bullish approach as long positions in individual stocks is being hedged by Nifty shorts.
-
The index heavy-weights are showing strength again. This in turn will boost the indices and cause a feel good factor. The only worry is that this upbeat sentiment should continue and the previous highs are surpassed.
-
Trades must be executed in small volumes due to the higher volatility expected. Trade fewer counters and conserve cash for future opportunities.
-
Standby for fresh recommendations via SMS on a real - time basis.
- Have a profitable week.
- Vijay L Bhambwani
- Ceo :- Bsplindia.com
The author is a Mumbai based investment consultant and invites feedback at Vijay@BSPLindia.com and ( 022 ) 23438482 / 23400345.
SEBI disclosure :- The author has no positions in any securities mentioned above.
- While all due care has been taken while in compiling the data enclosed herein, we cannot be held responsible for errors, if any, creeping in. Please consult an independent qualified investment advisor before taking investment decisions. This mail is not sent unsolicited, and only advisory in nature. We have accepted no consideration from any company mentioned above and recommend taking decisions on merits of the stocks from our viewpoint. This email is being sent to you as a paid subscriber. Please protect your interests and ours by not disclosing the contents to any un-authorised person/s
Legal notice :- The Professional Ticker Reader is a trademark of Bhambwani Securities (P) Ltd. and any un-authorised replication / duplication in part or full will be infringing our trademark and will result in legal action being enforced on the infringing persons / parties.
