- Your accurate, authentic and affordable guide to investing
Flavours of the week Feb 12, 2005
These are stocks that we expect to out-perform the markets. Cash and derivative strategies are advised thereon. Please stay online to enable loading of graphics from our servers. Please also read the trading tips section at the end of the newsletter.
|
Individual stocks. |
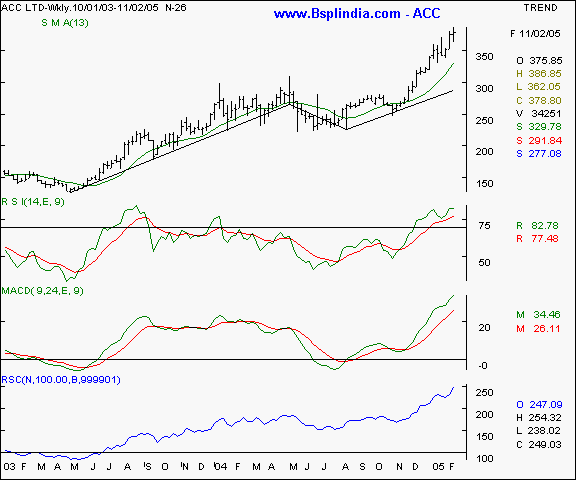
ACC - this cement major has managed to close at it's lifetime highs which is a sign of strength. Although the all time high on the monthly charts is slightly higher, it was in the frenzy of 1992. This scrip was recommended earlier vide our editions dtd Sept 12, Oct 23, Nov 21, Dec 05, 12 & 26, 2004 and Jan 02 & 09, 2005. Click here to view previous reports. The scrip boasts of tremendous relative strength and the oscillators support a bullish view. In our earlier edition, we had projected a price target of 425 + over the long term. We re-affirm the same target for the patient traders. Technical traders may note the 3 wave marking for simplicity. The corrective phase has been brief, less than 33 % of the prior move and the current upmove is yet to terminate. The probability of the 400 levels being tested in a conducive market in the near term is bright. We recommend a buy.
Your call of action -
-
Investors / cash segment players - buy on all significant declines below 370 and hold with a very liberal stop loss at the 330 - 335 levels. Expect to book profits at the 410 + levels in the medium term and 430 + in the longer term.
-
Aggressive F&O traders - buy the March futures ( currently quoting at Rs 5 premium to spot ) at the 380 levels and hold with a stop loss at the 371 mark. Expect profit taking at the 394 - 396 levels. Adventurous traders may await the 405 levels. Options players may buy the February 400 calls at Rs 3.
-
Derivatives contract size - Market lot = 1,500 shares. F&O margin = approx Rs 96,000 (subject to change daily )
ACC I Canara Bank I GAIL I Grasim I HDFC I ICICI Bank I Mah & Mah I Maruti I Reliance I TCS I BSE Sensex I Nifty I CNX-IT I Dow Jones I Nasdaq I FTSE I Top I Close window I Print page
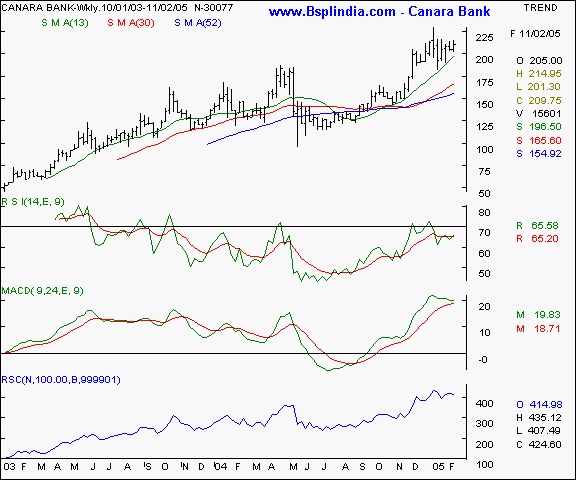
Canara Bank - this PSU banking major is showing signs of bullishness as the scrip makes a higher bottoms formation whereas the top has been confined to the 215 - 217 levels. This scrip was recommended earlier vide our editions dtd Sept 19 2004 and Jan 02 & 09, 2005. Click here to view previous reports. The scrip enjoys a high relative strength of 415 ( where 100 = base ) and is on the threshold of a breakout. We recommend a speculative buy on the counter after a confirmatory breakout is complete.
Your call of action -
-
Investors / cash segment players - buy above the 216 levels and hold with a stop loss at the 195 levels. Expect to book profits at the 240 + levels in the medium term in a conducive market.
-
Aggressive F&O traders - Buy the February futures above the 215 / 216 levels and hold with a stop loss at the 207 levels. Expect to book profits at the 225 - 228 levels in the near medium term. Please note that the higher the traded volumes on the breakout, the more the strength in the upmove. Options players may buy the Feb 220 calls at a premium of Rs 2.50
-
Derivatives contract size - Market lot = 1,600 shares. F&O margin = approx Rs 75,000 (subject to change daily )
ACC I Canara Bank I GAIL I Grasim I HDFC I ICICI Bank I Mah & Mah I Maruti I Reliance I TCS I BSE Sensex I Nifty I CNX-IT I Dow Jones I Nasdaq I FTSE I Top I Close window I Print page
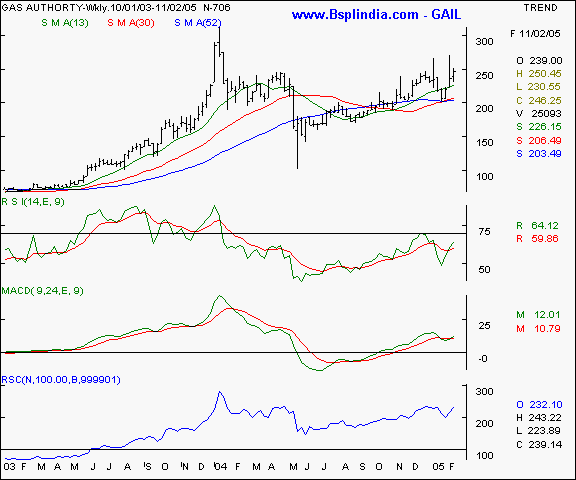
GAIL - this PSU gas major has been making rising tops and bottoms formation and seen a sharp correction to it's 52 week average. The 52 WSMA support has been intact and the scrip is on an uptrend again. We foresee an accelerated upmove once the 250 levels are surpassed with convincing volumes on a sustained closing basis. A buy is recommended for the patient investor / trader.
Your call of action -
-
Investors / cash segment players - buy above the 250 levels and hold with a liberal stop loss at the 224 levels. Expect profit taking at the 280 - 285 levels in a conducive market in the short / medium term.
-
Aggressive F&O traders - buy the March futures ( quoting at Rs 3 premium to cash ) above the 253 levels and hold with a stop loss at the 240 levels. Expect to book profits at the 275 - 278 levels in a conducive market in the short / medium term. Options players may buy the Feb 260 calls at a premium of Rs 2.25
-
Derivatives contract size - Market lot = 1,500 shares. F&O margin = approx Rs 66,000 (subject to change daily )
ACC I Canara Bank I GAIL I Grasim I HDFC I ICICI Bank I Mah & Mah I Maruti I Reliance I TCS I BSE Sensex I Nifty I CNX-IT I Dow Jones I Nasdaq I FTSE I Top I Close window I Print page
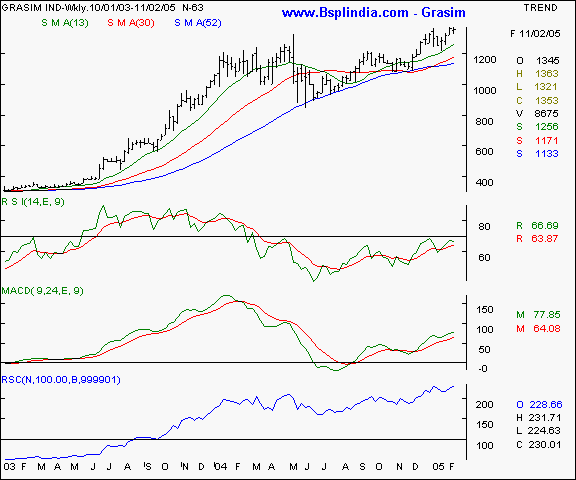
Grasim - this scrip was recommended as a buy above a confirmatory breakout above the 1368 levels which has eluded the bulls. This scrip was recommended earlier vide our editions dtd Oct 31, Dec 5 & 19, Jan 30 and Feb 06, 2005. Click here to view previous reports. This high relative strength stock has been making higher tops and bottoms and is supported by the momentum oscillators on the upsides. The moving averages are pointing upwards and a confirmatory breakout above the 1368 levels will propel this scrip in a new, zero resistance trading zone. We recommend a buy on a confirmed breakout.
Your call of action -
-
Investors / cash segment players - buy above the 1368 levels on a closing basis and hold with a stop loss at the 1320 levels. Expect to book profits above the 1425 levels in a conducive market in the near / medium term.
-
Aggressive F&O traders - buy the March futures ( quoting at par with cash ) above the 1369 levels and hold with a stop loss at the 1352 levels. Expect to book partial profits at the 1395 then complete profits at the 1425 levels in the near term in a conducive market. Options player do not much of a choice as the options are illiquid.
-
Derivatives contract size - Market lot = 350 shares. F&O margin = approx Rs 75,000 (subject to change daily )
ACC I Canara Bank I GAIL I Grasim I HDFC I ICICI Bank I Mah & Mah I Maruti I Reliance I TCS I BSE Sensex I Nifty I CNX-IT I Dow Jones I Nasdaq I FTSE I Top I Close window I Print page
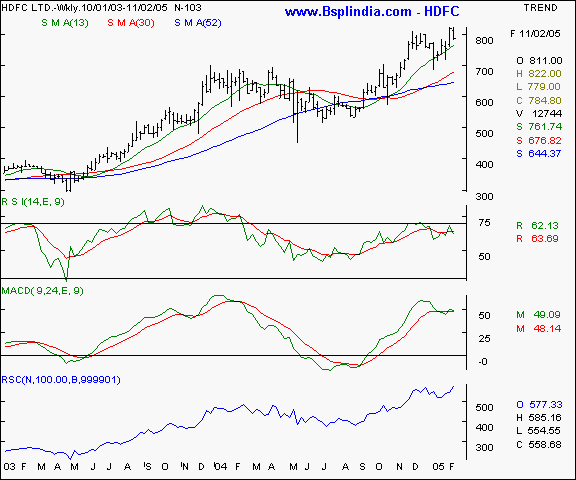
HDFC Ltd - This high relative strength scrip was recommended at the 800 levels and a liberal stop loss which it is nearing. This scrip was recommended earlier vide our editions dtd Nov 21, 2004 & Feb 06, 2005. Click here to view previous reports. Though we would like to modify the stop loss deeper down, and even suggest further buying as the support floor price is lower, our upward target remains intact. Notice the high relative strength in the counter at 577 ( where 100 = base ). We recommend a buy on all major declines.
Your call of action -
-
Investors / cash segment players - hold existing positions and add on declines to the 760 - 765 levels. Maintain a stop loss at the 740 - 750 levels and expect to book profits at the 850 + levels in the medium term in a conducive market.
-
Aggressive F&O traders - buy the March futures ( quoting at Rs. 9 premium to cash ) on declines to the 780 - 785 levels and hold with a liberal stop loss at the 740 - 745 levels. Expect profit taking at the 820 - 830 levels in a conducive market in the medium term. Options players do not a choice as the options segment is illiquid on this counter.
-
Derivatives contract size - Market lot = 600 shares. F&O margin = approx Rs 75,000 (subject to change daily )
ACC I Canara Bank I GAIL I Grasim I HDFC I ICICI Bank I Mah & Mah I Maruti I Reliance I TCS I BSE Sensex I Nifty I CNX-IT I Dow Jones I Nasdaq I FTSE I Top I Close window I Print page
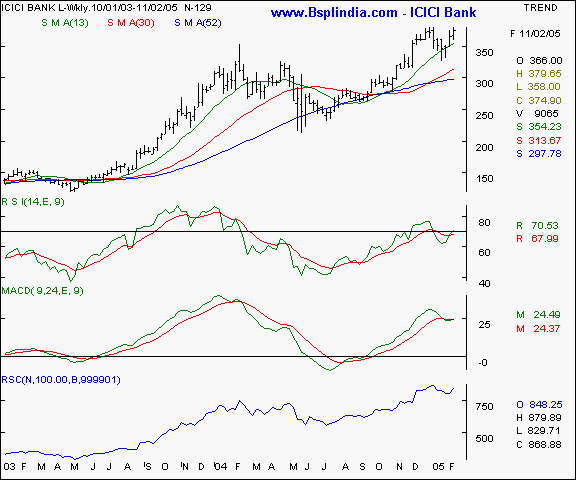
ICICI Bank - this banking major is in an uptrend and the chart is exhibiting strength as the higher tops and bottoms formation is intact. This scrip was recommended earlier vide our editions dtd Dec 26 2004. Click here to view previous reports. The 13 week SMA has been a historical support for the momentum traders and the same is currently poised at the 355 levels. We feel a breakout above the 382 levels will be an ideal confirmation for the bulls to enter this counter, provided the traded volumes also witness a surge. Technical traders may please note the high relative strength on this counter. A buy is recommended.
Your call of action -
-
Investors / cash segment players - buy above a confirmatory breakout above the 382 levels and hold with a liberal stop loss at the 364 levels. Expect profit taking at the 394 - 398 levels in a conducive market in the short / medium term.
-
Aggressive F&O traders - Buy the March futures ( quoting at Rs 2 premium to cash ) above the 383 levels and hold with a stop loss at the 376 levels. Expect profit taking at the 400 + levels in the short / medium term in a conducive market. Options players may buy the Feb 390 calls at Rs 3.50 premium.
-
Derivatives contract size - Market lot = 1,400 shares. F&O margin = approx Rs 90,000 (subject to change daily )
ACC I Canara Bank I GAIL I Grasim I HDFC I ICICI Bank I Mah & Mah I Maruti I Reliance I TCS I BSE Sensex I Nifty I CNX-IT I Dow Jones I Nasdaq I FTSE I Top I Close window I Print page
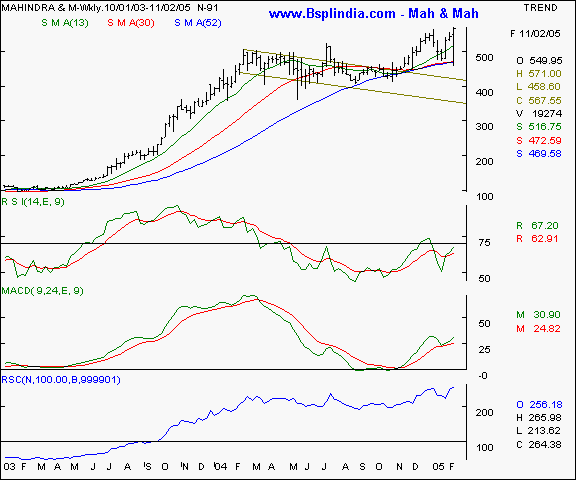
Mah & Mah - this scrip has been a frequent feature in our newsletters and has been a money spinner for the disciplined investor / trader. This scrip was recommended earlier vide our editions dtd Sept 19, Nov 14 & 27, Dec 05, 12, 19 & 26 2004, Jan 02, 09, 22 and Feb 06 2005. Click here to view previous reports. Technical traders may note that the scrip has managed to close at it's highest and is in a new trading zone altogether. The scrip boasts of a high relative strength and the oscillators are supporting a further rally. Since a significant appreciation has already occurred, we feel the upmove will be measured. A buy is recommended for the patient investor / trader only.
Your call of action -
-
Investors / cash segment players - buy on minor dips to the 555 - 560 levels and hold with a stop loss at the 530 levels. Expect part profit taking at the 575 - 585 levels in the medium term and complete profit taking at the 610 - 620 mark in the medium / long term.
-
Aggressive F&O traders - Buy the March futures ( quoting at Rs 3 premium to cash ) at the 570 levels and hold with a stop loss at the 558 mark. Expect profit taking at the 584 / 588 levels in the near / medium term. Over the longer term, expect 600 + levels in a conducive market. Options players may buy the Feb 580 calls at Rs 4 premium
-
Derivatives contract size - Market lot = 625 shares. F&O margin = approx Rs 58,000 (subject to change daily )
ACC I Canara Bank I GAIL I Grasim I HDFC I ICICI Bank I Mah & Mah I Maruti I Reliance I TCS I BSE Sensex I Nifty I CNX-IT I Dow Jones I Nasdaq I FTSE I Top I Close window I Print page
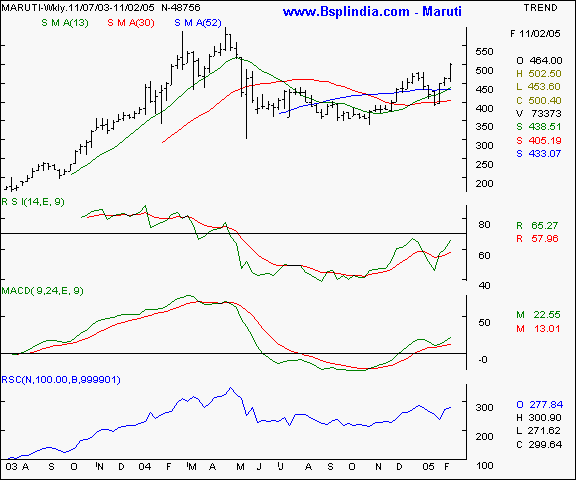
Maruti - this auto major has been consolidating upto last month and after taking support at the 30 week SMA, has started moving higher. This scrip was recommended earlier vide our editions dtd Oct 23, Dec 12 & 26 2004 and Jan 30, 2005. Click here to view previous reports. Technical traders may note that the previous highs have been surpassed and a close at the intraweek highs have been achieved. The oscillators are showing a strength in the undertone and we expect the uptrend to hold if the overall markets remain positive. The scrip enjoys a high relative strength of 277. We recommend a buy for the patient investor / trader.
Your call of action -
-
Investors / cash segment players - buy on minor declines to the 485 - 490 levels and hold with a stop loss at the 470 mark. Expect to book profits at 525 - 530 levels in a conducive market in the short / medium term.
-
Aggressive F&O traders - Buy the March futures ( quoting at par with cash ) at the 500 levels and hold with a stop loss at the 489 mark. Expect profit taking at the 512 - 514 levels. Options players may buy the Feb 510 calls at Rs 6 premium.
-
Derivatives contract size - Market lot = 400 shares. F&O margin = approx Rs 33,000 (subject to change daily )
ACC I Canara Bank I GAIL I Grasim I HDFC I ICICI Bank I Mah & Mah I Maruti I Reliance I TCS I BSE Sensex I Nifty I CNX-IT I Dow Jones I Nasdaq I FTSE I Top I Close window I Print page
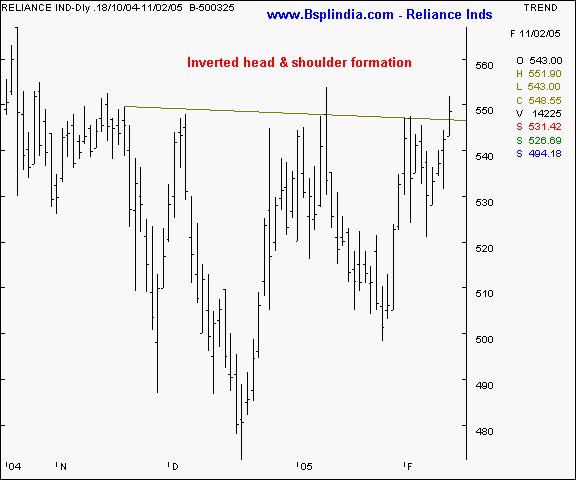
Reliance Inds - this scrip has been rather quiet of late and consolidating between the 520 and the 545 levels. This scrip was recommended earlier vide our editions dtd Sept 12, Oct 23 & 31, Nov 21 & 27 and Dec 05, 2004. Click here to view previous reports. On Friday, an interesting pattern has unfolded which need to be confirmed on Monday's trade. The inverted head and shoulders pattern is a measuring move that enables technical analysts to forecast price movements with reasonable accuracy. The neckline drawn as a trendline is poised at the 547 mark and a sustained closing / upmove from this point will confirm the head and shoulder formation, provided the traded volumes are higher than normal. In that case, the ideal textbook target on the upside for this counter will be at the 564 levels in the near future. In case of a bullish market, over the medium term significantly higher levels are possible. Much will depend on the traded volumes on the breakout above the neckline. The higher the volumes, the more sustainable the upmove. We recommend a buy.
Your call of action -
-
Investors / cash segment players - buy above the 552 levels and hold with a stop loss at the 542 levels. Expect profit taking at the 564 / 570 levels in the near term. Over the longer term, expect higher levels.
-
Aggressive F&O traders - Buy the February futures ( quoting at Rs 2 premium to cash ) above the 553 levels and hold with a stop loss at the 544 levels. Expect profit taking at the 565 levels in a conducive market in the near term. Options players may buy the February 560 calls at Rs 8.
-
Derivatives contract size - Market lot = 600 shares. F&O margin = approx Rs 55,000 (subject to change daily )
ACC I Canara Bank I GAIL I Grasim I HDFC I ICICI Bank I Mah & Mah I Maruti I Reliance I TCS I BSE Sensex I Nifty I CNX-IT I Dow Jones I Nasdaq I FTSE I Top I Close window I Print page
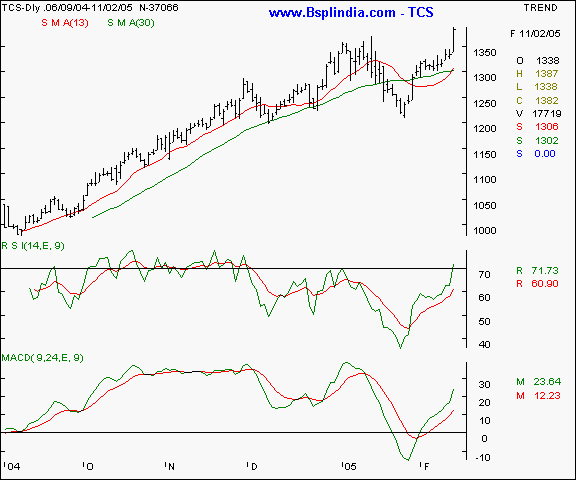
TCS - this technology bell weather has been a frequent feature in this edition and has simply out-performed the markets, it's peers and set new bench marks in the sector. This scrip was recommended earlier vide our editions dtd Oct 17, Nov 27, Dec 05 & 12 2004, Jan 02, 09 and 30 2005. Click here to view previous reports. The scrip has an extremely high relative strength and has signalled a strong breakout into a zero resistance zone. Please note that the fall to the 1200 - 1205 levels was exactly 0.382 % and completed an important elliot pattern. The next upmove can take it past the 1440 levels with relative ease, provided the markets are conducive. We recommend a buy.
Your call of action -
-
Investors / cash segment players - buy on minor declines to the 1365 - 1370 levels and hold with a stop loss at the 1330 levels. Expect profit taking at the 1410 - 1430 levels in a conducive market in the near / medium term.
-
Aggressive F&O traders - Buy the March futures ( quoting at Rs 4 premium to cash ) at the 1375 - 1378 levels and hold with a stop loss at the 1348 mark. Expect profit taking at the 1425 - 1435 levels in a conducive market in the medium term. Options players may buy the Feb 1440 calls at Rs. 4 premium.
-
Derivatives contract size - Market lot = 250 shares. F&O margin = approx Rs 53,000 (subject to change daily )
ACC I Canara Bank I GAIL I Grasim I HDFC I ICICI Bank I Mah & Mah I Maruti I Reliance I TCS I BSE Sensex I Nifty I CNX-IT I Dow Jones I Nasdaq I FTSE I Top I Close window I Print page
|
Indices - domestic |
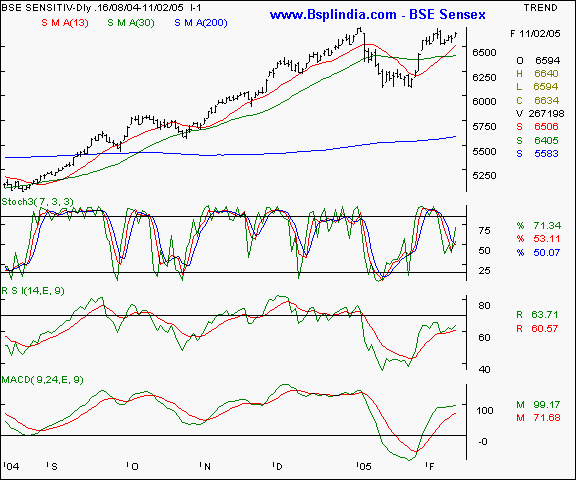
BSE Sensex - the Sensex has managed to stay above the 6500 levels which is a crucial short term floor for the markets. As long as the index stays above the 6500 mark in the coming week, the uptrend is likely to continue. The upsides will be minor resistance at the 6684 levels and thereafter at the previous top. The probability of surpassing the previous high is bright.
Your call of action - Since the Sensex futures are not very liquid, we suggest trading the Nifty 50 instead.
ACC I Canara Bank I GAIL I Grasim I HDFC I ICICI Bank I Mah & Mah I Maruti I Reliance I TCS I BSE Sensex I Nifty I CNX-IT I Dow Jones I Nasdaq I FTSE I Top I Close window I Print page
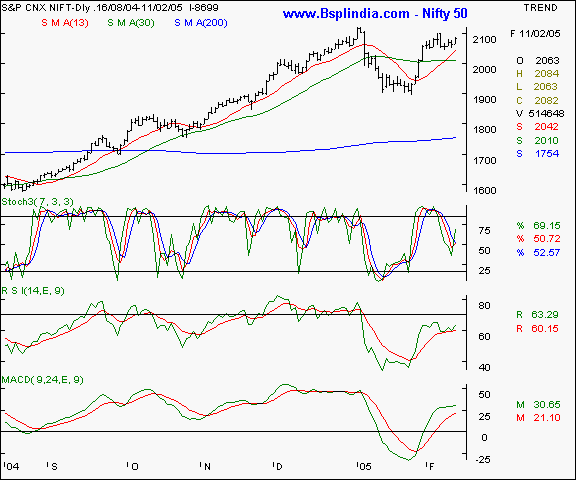
Nifty 50 - the Nifty has managed to bounce back from the 2048 support which is a crucial short term floor. We feel that the index should not fall the 2034 levels before the budget. Momentum traders should watch the 2064 levels above which long positions maybe held. Patient investors may keep a stop loss at the 2048 levels. Above the 2080 levels on a sustainable closing basis, expect the 2120 levels to be tested. We maintain an optimistic view on the Nifty.
Your call of action - Initiate long positions as long as the Nifty spot stays above the 2080 levels. Book part profits at the 2100 levels and complete profit taking at the 2120 levels. A stop loss at the 2060 levels is advisable.
ACC I Canara Bank I GAIL I Grasim I HDFC I ICICI Bank I Mah & Mah I Maruti I Reliance I TCS I BSE Sensex I Nifty I CNX-IT I Dow Jones I Nasdaq I FTSE I Top I Close window I Print page
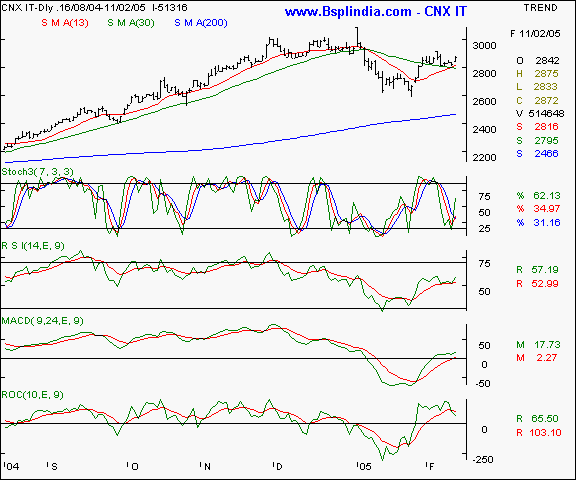
CNX IT - the IT index has seen a bounce-back after a sharp fall below the 2600 levels. The index has managed to close above it's short term averages and the oscillators are pointing towards a further upmove in the offing. Above 2900, the index has the potential to rally another 1. 5 - 2 %. We recommend a buy for the high risk profile traders.
Your call of action - By the February futures above the 2860 levels and hold with a stop loss at 2840 levels. Expect profit taking at the 2885 - 2890 levels.
ACC I Canara Bank I GAIL I Grasim I HDFC I ICICI Bank I Mah & Mah I Maruti I Reliance I TCS I BSE Sensex I Nifty I CNX-IT I Dow Jones I Nasdaq I FTSE I Top I Close window I Print page
|
Indices - international |
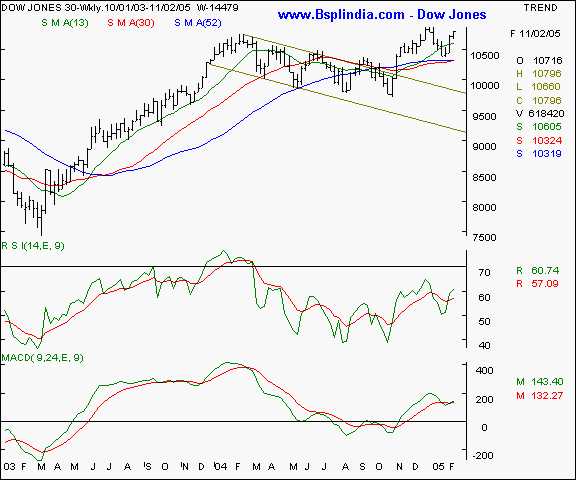
Dow Jones Industrial Average - the Dow has managed to close higher for the third consecutive week and that is a sign of optimism. As advocated last week, the 10800 levels are proving to be an immediate resistance. The 10600 will be a short term floor and the upsides will see resistance at the 10920 in the coming week.
Your call of action - Since Indian investors are not allowed to trade in overseas markets, this is a pure academic study.
ACC I Canara Bank I GAIL I Grasim I HDFC I ICICI Bank I Mah & Mah I Maruti I Reliance I TCS I BSE Sensex I Nifty I CNX-IT I Dow Jones I Nasdaq I FTSE I Top I Close window I Print page
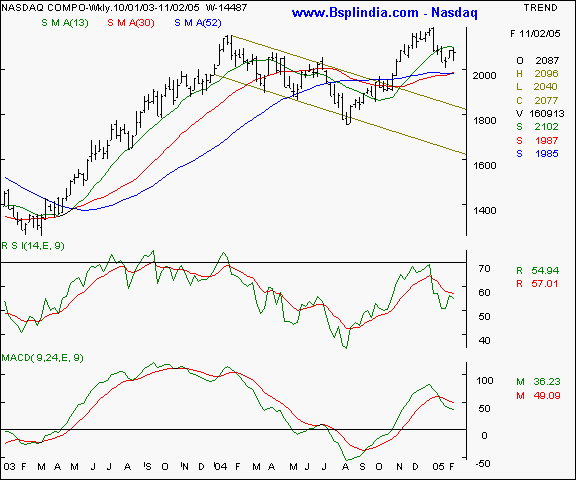
Nasdaq - the Nasdaq has been under pressure and is underperforming the Dow Jones average. The 1990 levels are a strong floor and the 2115 will be a strong short term resistance above which it must close to reverse the weak trend.
Your call of action - Since Indian investors are not allowed to trade in overseas markets, this is a pure academic study.
ACC I Canara Bank I GAIL I Grasim I HDFC I ICICI Bank I Mah & Mah I Maruti I Reliance I TCS I BSE Sensex I Nifty I CNX-IT I Dow Jones I Nasdaq I FTSE I Top I Close window I Print page
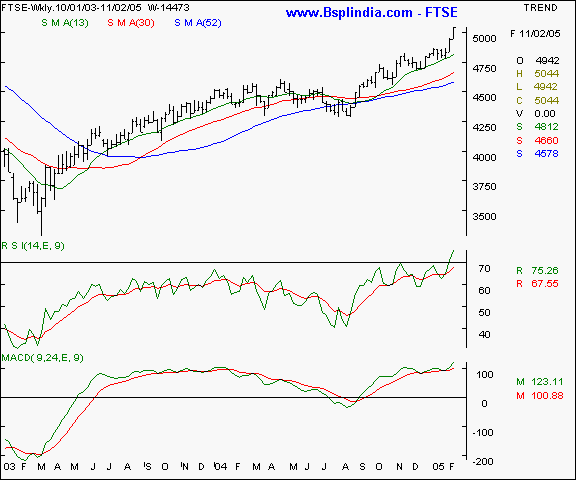
FTSE - The FTSE is by and far the strongest of the overseas indices and is displaying signs of absolute strength as it hits a new intermediate high. The overhead resistance is at the 5165 levels and the support at the 4980 levels.
Your call of action - Since Indian investors are not allowed to trade in overseas markets, this is a pure academic study.
ACC I Canara Bank I GAIL I Grasim I HDFC I ICICI Bank I Mah & Mah I Maruti I Reliance I TCS I BSE Sensex I Nifty I CNX-IT I Dow Jones I Nasdaq I FTSE I Top I Close window I Print page
|
Trading tips for the week |
-
The put / call ratio is climbing and is currently at the 0.34 : 1 levels and the outstanding positions in the derivatives segment have shown a qualitative increase. The FII investments are continuing steadily.
-
The current week is crucial for the markets as the pre budget rally must commence or the markets will be unable to gather upward momentum due to expiry worries.
-
The index heavy-weights are showing strength again. This in turn will boost the indices and cause a feel good factor. The only worry is that this upbeat sentiment should continue.
-
Trades must be executed in small volumes due to the higher volatility expected. Trade fewer counters and conserve cash for future opportunities.
-
Standby for fresh recommendations via SMS on a real - time basis.
- Have a profitable week.
- Vijay L Bhambwani
- Ceo :- Bsplindia.com
The author is a Mumbai based investment consultant and invites feedback at Vijay@BSPLindia.com and ( 022 ) 23438482 / 23400345.
SEBI disclosure :- The author has no positions in any securities mentioned above.
- While all due care has been taken while in compiling the data enclosed herein, we cannot be held responsible for errors, if any, creeping in. Please consult an independent qualified investment advisor before taking investment decisions. This mail is not sent unsolicited, and only advisory in nature. We have accepted no consideration from any company mentioned above and recommend taking decisions on merits of the stocks from our viewpoint. This email is being sent to you as a paid subscriber. Please protect your interests and ours by not disclosing the contents to any un-authorised person/s
Legal notice :- The Professional Ticker Reader is a trademark of Bhambwani Securities (P) Ltd. and any un-authorised replication / duplication in part or full will be infringing our trademark and will result in legal action being enforced on the infringing persons / parties.
