- Your accurate, authentic and affordable guide to investing
Flavours of the week Feb 19, 2005
These are stocks that we expect to out-perform the markets. Cash and derivative strategies are advised thereon. Please stay online to enable loading of graphics from our servers. Please also read the trading tips section at the end of the newsletter.
|
Individual stocks. |
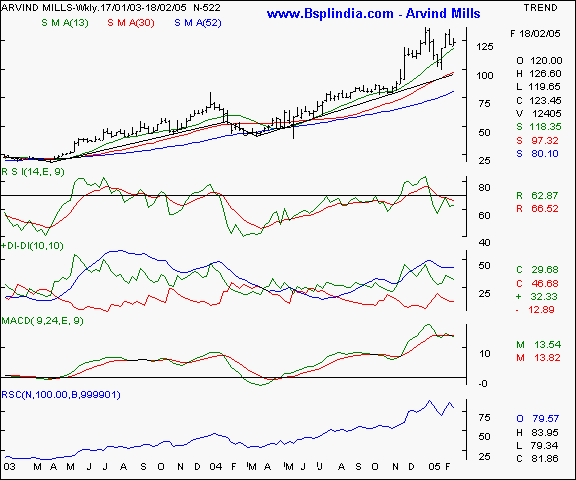
Arvind Mills - this scrip was recommended by us frequently and has been a market out-performer. Previous recommendations were dtd Sept 05, Oct 31 2004, Jan 16 and 22, 2005. Click here to view the previous recommendations. Technical traders may note that the scrip has exhibited clear wavular movement and is in the 3 rd wave which is projecting a resistance at the 138 - 140 levels. This is also the point where the scrip has returned lower after an intraday high. Currently the scrip is in a consolidation mode and is likely to drift lower with an overall slide in the markets. We feel the 105 - 110 levels will be an important retracement support below which the scrip is unlikely to go significantly lower in the near term. Note also the directional move oscillator is indicating that the overall trend remains bullish and the current fall is a routine correction. We recommend a buy on major declines and also an exotic options strategy as below.
Your call of action -
-
Investors / cash segment players - buy on declines to the 105 - 110 levels and hold with a maximum stop loss at the 95 levels. Expect to book profits at the 120 - 125 levels in the medium term. Over the longer term, we expect even higher levels.
-
Aggressive F&O traders - Buy the march futures ( quoting at Rs 1.50 premium to cash ) on lower levels of 118 - 120. Hold with a stop loss at the 113 - 114 levels. Expect to book profits at the 125 - 128 levels in the medium term in a conducive market. Alternate strategy would be to initiate sales of March 140 calls ( after the futures trade is initiated ) at a suggested premium of Rs 1.75 - 2.00 in equal quantities as the futures. Till the price line remains below the 140 upto March 31 2005, the options will yield a return in the form of premium collected and lower the cost of the futures by similar amounts. This dual strategy will work after the march series get liquid after a few sessions though.
-
Derivatives contract size - Market lot = 4,300 shares. F&O margin = approx Rs 1,07,000 (subject to change daily )
Arvind Mills I BEL I BHEL I Grasim I ICICI Bank I Petronet LNG I NTPC I Raymonds I Tisco I Tata Power I BSE Sensex I Nifty I CNX-IT I Dow Jones I Nasdaq I FTSE I Top I Close window I Print page
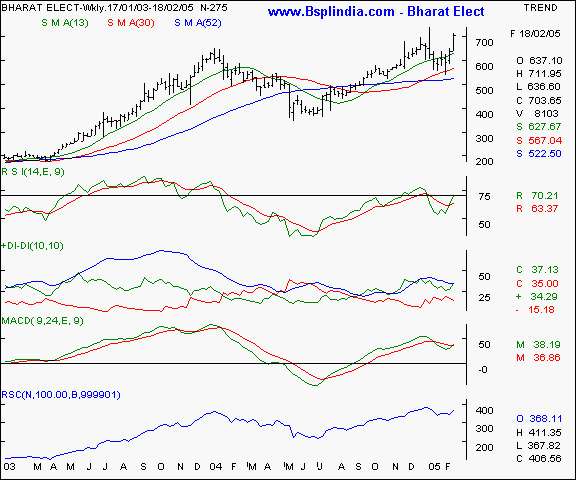
Bharat Electronics - this scrip was recommended earlier vide our editions dtd. Sept 19, Oct 03, Nov 07, 14, 27 and Dec 19, 2004. Click here to view the previous recommendations. Note the very high relative strength of 366 and the higher tops and bottoms chart formation. The corrective fall between Dec 03 - June 04 did not erase more than the stipulated gains from the earlier rally, which pointed to an underlying strength. The directional movement oscillator is pointing towards a strength in the upmove and a consistent close above the 700 mark will be a sure confirmation of the bullishness in the counter. We recommend a buy for the patient and disciplined trader / investor for the medium / long term.
Your call of action -
-
Investors / cash segment players - buy on minor declines to the 680 - 690 levels and hold with a liberal stop loss at the 660 levels. Expect to book profits at the 740 - 750 levels in a conducive market environment in the medium term.
-
Aggressive F&O traders - buy the March futures ( quoting at Rs 7 premium to cash ) at the 700 - 705 levels and hold with a stop loss at the 672 - 676 levels. Expect profit taking at the 735 - 740 levels once a consistent close above the 710 levels is achieved. Options players may not have a choice due to liquidity problems.
-
Derivatives contract size - Market lot = 550 shares. F&O margin = approx Rs 62,000 (subject to change daily )
Arvind Mills I BEL I BHEL I Grasim I ICICI Bank I Petronet LNG I NTPC I Raymonds I Tisco I Tata Power I BSE Sensex I Nifty I CNX-IT I Dow Jones I Nasdaq I FTSE I Top I Close window I Print page
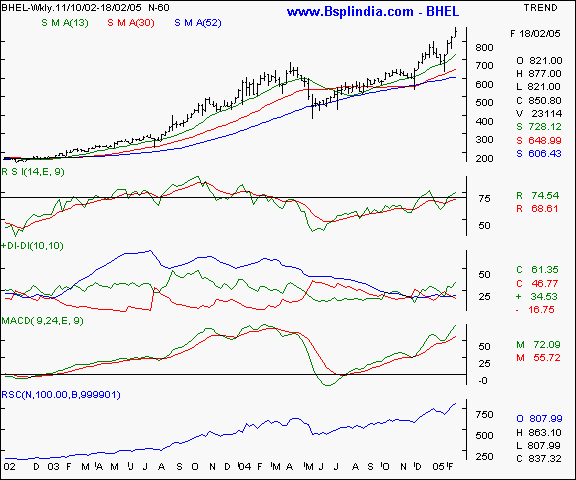
BHEL - this scrip was recommended by us vide our earlier editions dtd. Sept 05, Oct 10, Dec 12 and 19, 2004, Jan 09 & 30 and Feb 06, 2005. Click here to view the previous recommendations. A projected price of 825 / 840 was advocated when the then current levels were 725. That target has been achieved before the budget. We feel the chart pattern is suggestive of further strength and the oscillators are displaying a positive co-relation in tandem with the price chart. The relative strength is very high at 808 and the scrip has achieved a breakout into a new trading zone where no recorded resistance levels are known. We revise our price target to 914 levels as per the time / price projections available. Corrective falls in the interim maybe seen. Buying is recommended for the higher risk appetite trader / investor.
Your call of action -
-
Investors / cash segment players - buy the scrip on declines to the 810 - 825 levels and hold with s top loss at the 775 levels. Expect to book profits at the 900 - 910 levels in a conducive market in the short / medium term.
-
Aggressive F&O traders - buy the March futures ( quoting at Rs 4 premium to cash ) at the 835 - 840 levels. Hold with a stop loss at the 822 levels. Expect profit taking at the 880 - 885 levels in the near / medium term. Longer term projections are significantly higher.
-
Derivatives contract size - Market lot = 600 shares. F&O margin = approx Rs 86,000 (subject to change daily )
Arvind Mills I BEL I BHEL I Grasim I ICICI Bank I Petronet LNG I NTPC I Raymonds I Tisco I Tata Power I BSE Sensex I Nifty I CNX-IT I Dow Jones I Nasdaq I FTSE I Top I Close window I Print page
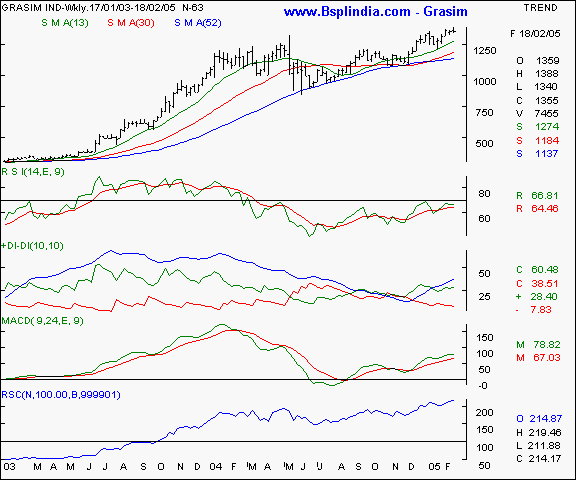
Grasim - this scrip was recommended vide our earlier editions dtd. Oct 31, Dec 05 & 19, Jan 30, Feb 06 & 13, 2005. Click here to view the previous recommendations. The breakout that we advocated at the 1368 levels was achieved and the scrip has failed to take off after the event. The underlying undercurrents remain firm and the oscillators are signalling a bullish outlook. The relative strength is high at 215 ( where 100 = base ) and the directional index is showing a firm reading. We feel a sustained closing above the 1368 will propel the stock into a bull orbit where the scrip will trade in new lifetime highs. We recommend a buy.
Your call of action -
-
Investors / cash segment players - buy the scrip at current levels and hold with a very liberal stop loss at the 1285 / 1290 levels. Expect to book profit at the 1440 - 1450 levels in a conducive market in the medium term.
-
Aggressive F&O traders - Buy the march futures ( quoting at Rs 7 premium to cash ) at the 1350 levels and hold with a stop loss at the 1314 levels. Expect profit taking at the 1385 partially and the 1410 completely in the near term in a conducive market. Over the longer term, we expect higher prices.
-
Derivatives contract size - Market lot = 350 shares. F&O margin = approx Rs 75,000 (subject to change daily )
Arvind Mills I BEL I BHEL I Grasim I ICICI Bank I Petronet LNG I NTPC I Raymonds I Tisco I Tata Power I BSE Sensex I Nifty I CNX-IT I Dow Jones I Nasdaq I FTSE I Top I Close window I Print page
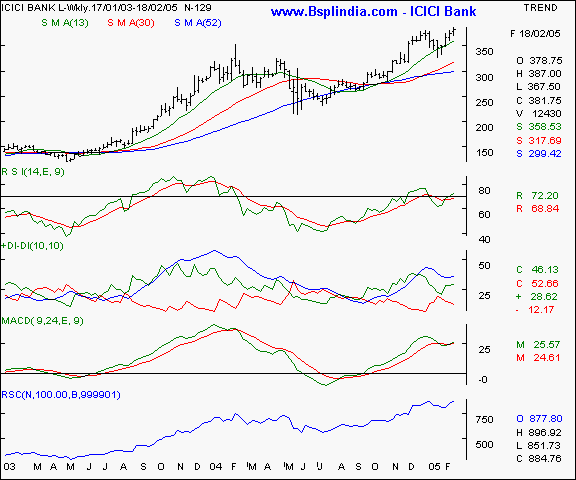
ICICI Bank - this banking major was recommended vide our editions dtd Nov 26 2004 and Feb 13, 2005. Click here to view the previous recommendations. The stock has broken out into a new bullish groove and is showing a strong chart formation. A higher tops and bottoms formation is being seen and the oscillators are supporting the rally. The scrip has a high relative strength of 878 and the stock is a market out-performer. As long as the scrip remains above the 380 mark, the chances of 415 - 425 are fairly high. We recommend a buy for the patient and disciplined trader / investor.
Your call of action -
-
Investors / cash segment players - buy as long as the price graph stays above the 380 levels and hold with a stop loss at the 355 levels. Expect profit taking at the 415 - 425 levels in a conducive market in the near / medium term. Longer term players may expect higher levels.
-
Aggressive F&O traders - Buy the March futures ( quoting at Rs 5 premium to cash ) as long as the scrip stays above the 383 levels. Hold with a stop loss at the 372 levels and expect profit taking at the 398 levels partially. In a significantly strong market, expect the 405 - 408 levels in the medium term.
-
Derivatives contract size - Market lot = 1400 shares. F&O margin = approx Rs 89,000 (subject to change daily )
Arvind Mills I BEL I BHEL I Grasim I ICICI Bank I Petronet LNG I NTPC I Raymonds I Tisco I Tata Power I BSE Sensex I Nifty I CNX-IT I Dow Jones I Nasdaq I FTSE I Top I Close window I Print page
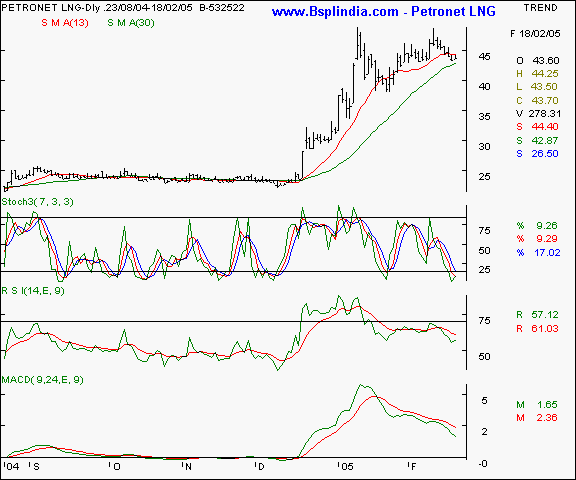
Petronet LNG - this scrip has seen a significant flare up in the last calendar quarter and is fast growing into a strong market out-performer. The daily chart is suggesting a consolidation / correction and the scrip is likely to take support at the 40 / 42 levels where a short term floor price is expected. Ling term investors are advocated to buy this multi bagger in the making with abundant patience for excellent returns.
Your call of action -
-
Investors / cash segment players - buy on all declines to the 40 - 41 levels and hold with a stop loss at the 35 levels. Expect to book profits at the 60 + levels in the medium term ( upto 6 months ) and significantly higher levels over a longer period of time.
-
Aggressive F&O traders - f&o n/a.
-
Derivatives contract size - f&o n/a.
Arvind Mills I BEL I BHEL I Grasim I ICICI Bank I Petronet LNG I NTPC I Raymonds I Tisco I Tata Power I BSE Sensex I Nifty I CNX-IT I Dow Jones I Nasdaq I FTSE I Top I Close window I Print page
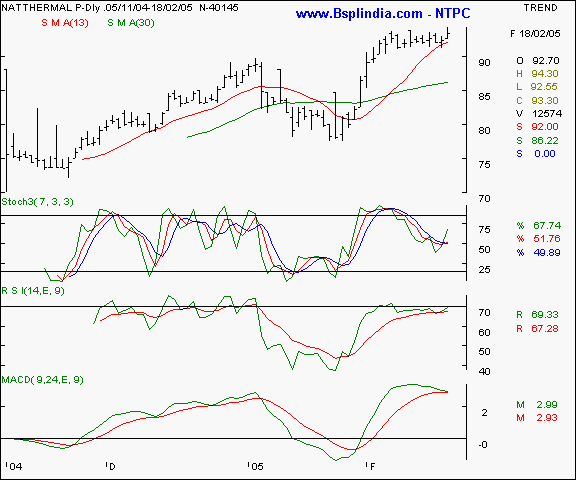
NTPC - this scrip has been a frequent feature in our PTR / flavours / sms recommendations and has performed exceedingly well. We recommended this scrip vide our past editions dtd Dec 26 2004, Jan 01, 09 & 30 and Feb 06, 2005. Click here to view the previous recommendations. The scrip has broken out of a congestion band of 92 - 93 and managed a close above this level. As long as close is maintained above the 93 mark, the stock is likely to witness a bullish outlook. Hi risk, short term players can venture a buy in small lots.
Your call of action -
-
Investors / cash segment players - buy the scrip in small lots at the current levels and leave room for averaging down to the 90 levels. Hold with a stop loss at the 87 / 88 levels and expect profit taking at the 105 - 110 levels in a conducive market in the short / medium term.
-
Aggressive F&O traders - buy the march futures ( quoting at 0.60 discount to cash ) at the 91.50 levels and hold with stop loss at the 88 - 89 levels. Expect to book profits at the 96 - 97 levels in a conducive market in the medium term.
-
Derivatives contract size - Market lot = 3250 shares. F&O margin = approx Rs 48,000 (subject to change daily )
Arvind Mills I BEL I BHEL I Grasim I ICICI Bank I Petronet LNG I NTPC I Raymonds I Tisco I Tata Power I BSE Sensex I Nifty I CNX-IT I Dow Jones I Nasdaq I FTSE I Top I Close window I Print page
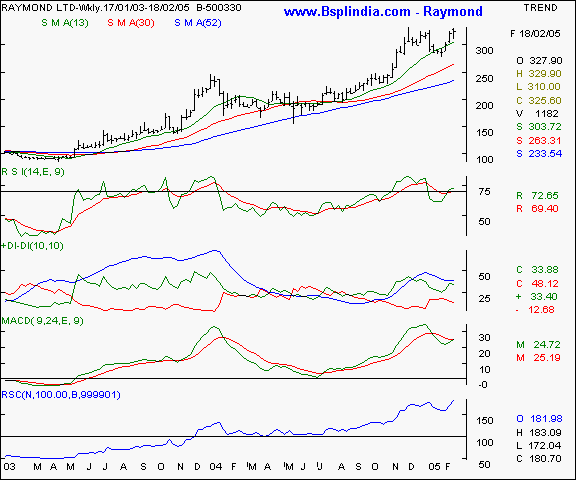
Raymonds - this often repeated scrip is performing as per our expectations and has shown signs of bottoming out of a corrective phase. Previous recommendations were dtd Sept 19, Nov 21 & 27, 2004 and Jan 16, 2005. Click here to view the previous recommendations. A high relative strength scrip with a reading of 182 ( where 100 = base ), this scrip is likely to show an accelerated upmove above the 330 levels on a closing basis. The directional index is showing a bullish undertone and we recommend a buy.
Your call of action -
-
Investors / cash segment players - buy the scrip on all declines to the 300 levels and hold with a stop loss at the 280 / 285 levels. expect to book profits at the 375 / 385 levels in a medium term time frame.
-
Aggressive F&O traders - f&o n/a.
-
Derivatives contract size - f&o n/a.
Arvind Mills I BEL I BHEL I Grasim I ICICI Bank I Petronet LNG I NTPC I Raymonds I Tisco I Tata Power I BSE Sensex I Nifty I CNX-IT I Dow Jones I Nasdaq I FTSE I Top I Close window I Print page
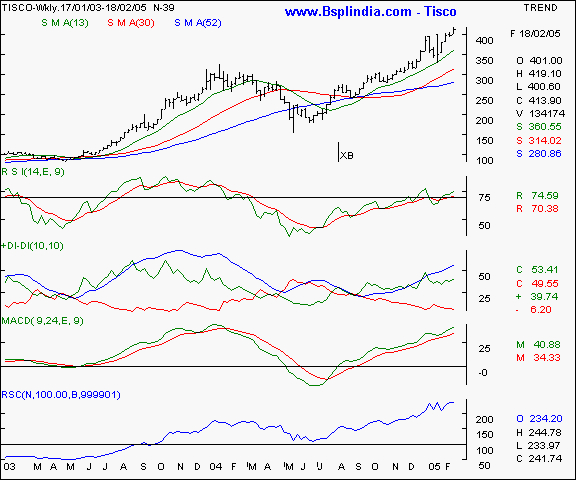
Tisco - this scrip has the distinction of having the highest open interest in the futures segment. This scrip was recommended in our previous editions dtd. Sept 19 & 26, Oct 03, 10 & 23, Nov 07 & 14, Dec 19 2004 and Jan 06, 22 & 30, 2005 Click here to view the previous recommendations. The chart pattern suggests a higher tops and bottoms formation and the move is supported by the oscillators. The directional index is particularly positive and the relative strength is high at 234 ( where 100 = base ). We recommend a buy for the higher risk appetite trader and the patient investor.
Your call of action -
-
Investors / cash segment players - buy the scrip on all declines to the 410 levels and keep a stop loss at the 388 levels. Expect part profit taking at the 424 / 427 levels and complete profit taking at the 440 levels in the medium term.
-
Aggressive F&O traders - buy the March futures ( quoting at Rs 3 premium to cash ) at the 414 - 415 levels and hold with a stop loss at the 410 levels. Expect profit taking at the 422 - 425 levels in a conducive market in the near / medium term.
-
Derivatives contract size - Market lot = 1350 shares. F&O margin = approx Rs 95,000 (subject to change daily )
Arvind Mills I BEL I BHEL I Grasim I ICICI Bank I Petronet LNG I NTPC I Raymonds I Tisco I Tata Power I BSE Sensex I Nifty I CNX-IT I Dow Jones I Nasdaq I FTSE I Top I Close window I Print page
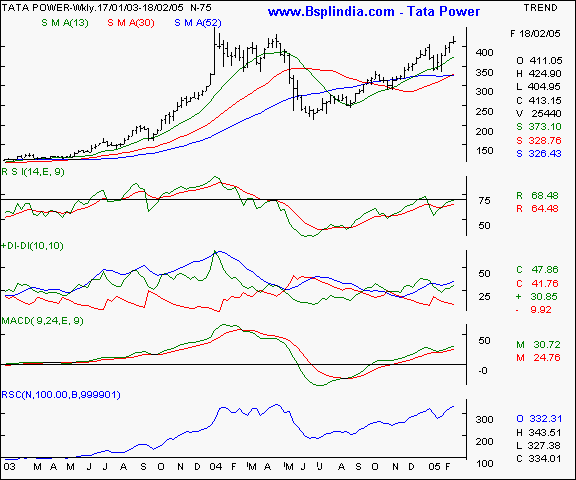
Tata Power - this scrip was recommended in our recent editions dtd Sept 12 & 26, Oct 03, Nov 14, Dec 12, 2004 and Jan 16, 22, Feb 06, 2005 and has performed as per expectations. Click here to view the previous recommendations. The oscillators are pointing towards a bullish undertone and the scrip enjoys a high relative strength of 332 on the charts. The scrip is making a higher tops and bottoms formation and is on the threshold of a breakout into the lifetime highs once the 428 levels are surpassed. We recommend a buy for the patient investor / trader.
Your call of action -
-
Investors / cash segment players - buy the scrip on all declines till the 400 levels and hold with a stop loss at the 375 levels. Expect to book profits at the 440 - 450 levels in the medium term in a conducive market. Over the longer term, expect higher levels.
-
Aggressive F&O traders - Buy the March futures ( quoting at Rs 2 premium to cash ) at the 410 - 413 levels. Hold with a stop loss at the 402 levels and expect to book profits at the 425 levels partially and Rs 438 levels totally in the medium term in a conducive market.
-
Derivatives contract size - Market lot = 800 shares. F&O margin = approx Rs 62,000 (subject to change daily )
Arvind Mills I BEL I BHEL I Grasim I ICICI Bank I Petronet LNG I NTPC I Raymonds I Tisco I Tata Power I BSE Sensex I Nifty I CNX-IT I Dow Jones I Nasdaq I FTSE I Top I Close window I Print page
|
Indices - domestic |
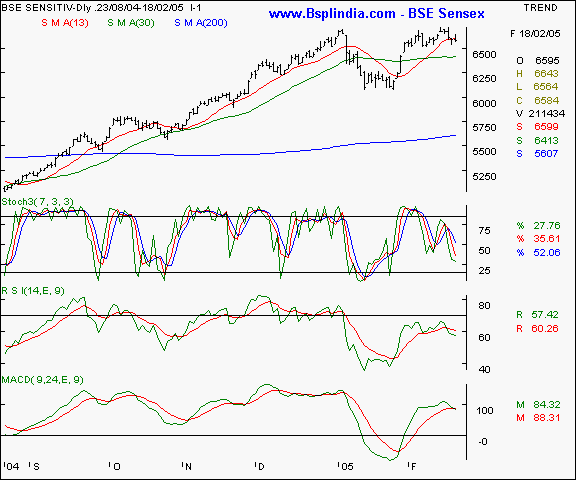
BSE Sensex - ths Sensex is showing signs of consolidation after hitting a high above the 6700 levels. The 6485 / 6500 levels are a critical short term floor below which the sensex must not close on a sustained closing basis if the current upmove is to sustain itself. The oscillators are showing signs of profit taking and the index is likely to remain under pressure as long as the 6715 levels are not surpassed on a continous closing basis.
Your call of action - Since the Sensex futures are not very liquid, we suggest trading the Nifty 50 instead.
Arvind Mills I BEL I BHEL I Grasim I ICICI Bank I Petronet LNG I NTPC I Raymonds I Tisco I Tata Power I BSE Sensex I Nifty I CNX-IT I Dow Jones I Nasdaq I FTSE I Top I Close window I Print page
Nifty 50 - the Nifty is showing signs of a range-bound trade with the upper band being at the 2085 - 2110 and the 2044 levels being the floor. It is crucial that the Nifty signal a breakout / breakdown to indicate a directional movement. Under no circumstances should the Nifty close below the 2034 levels on a consistent closing basis if the uptrend is to be maintained. A breakout above the 2120 levels with volumes will confirm the bullishness in the counter and the beginning of a new bull orbit. Being the expiry week and also the last week before the budget, the coming days will be make or break for the Nifty.
Your call of action - Short the March futures if the spot prices remain below the 2044 levels and the market fails to lift higher. Maintain a stop loss at the 2052 levels and a target of 2032 - 2034 in the short term. On the upsides, buy only if the Nifty spot stays convincingly above the 2065 levels, stop loss at the 2055 and target of 2078 - 2082.
Arvind Mills I BEL I BHEL I Grasim I ICICI Bank I Petronet LNG I NTPC I Raymonds I Tisco I Tata Power I BSE Sensex I Nifty I CNX-IT I Dow Jones I Nasdaq I FTSE I Top I Close window I Print page
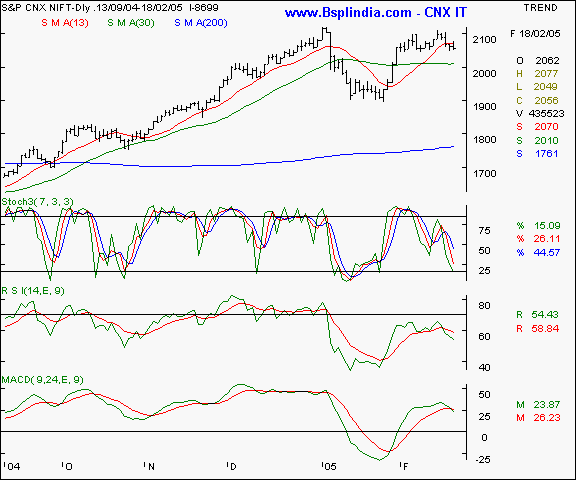
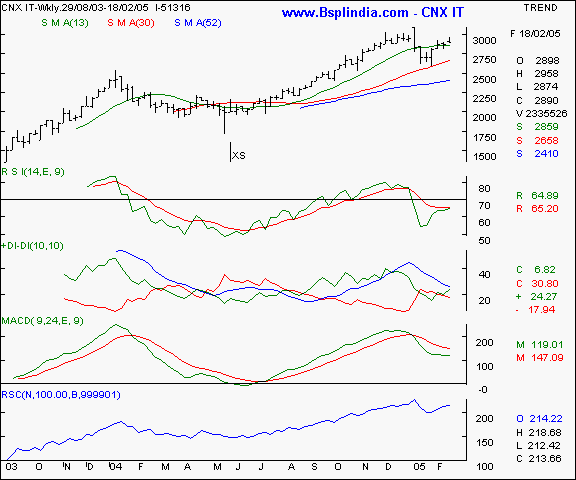
CNX IT - this IT index is showing signs of resistance at higher levels as the 3000 levels are proving to be a strong hurdle for the index. Though the outlook is improving, the trend will be conclusively bullish only above the 3000 mark with high volumes. Watch the 2835 levels keenly for signs of weakness.
Your call of action - Since the CNX IT futures are not as liquid, we suggest trading the Nifty 50 instead.
Arvind Mills I BEL I BHEL I Grasim I ICICI Bank I Petronet LNG I NTPC I Raymonds I Tisco I Tata Power I BSE Sensex I Nifty I CNX-IT I Dow Jones I Nasdaq I FTSE I Top I Close window I Print page
|
Indices - international |
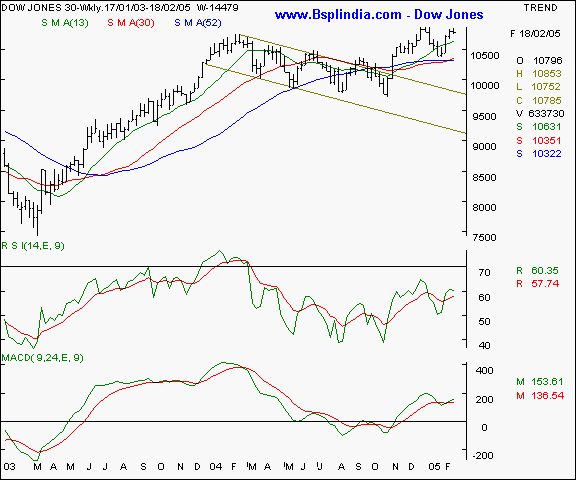
Dow Jones Industrial Average - the Dow has snapped it's 3 week gaining spree to ease off as the interest rate news has been a brake on sentiments. We expect the 10920 levels to be a major short term resistance and the support to be at the 10655 levels.
Your call of action - Since Indian investors are not allowed to trade in overseas markets, this is a pure academic study.
Arvind Mills I BEL I BHEL I Grasim I ICICI Bank I Petronet LNG I NTPC I Raymonds I Tisco I Tata Power I BSE Sensex I Nifty I CNX-IT I Dow Jones I Nasdaq I FTSE I Top I Close window I Print page
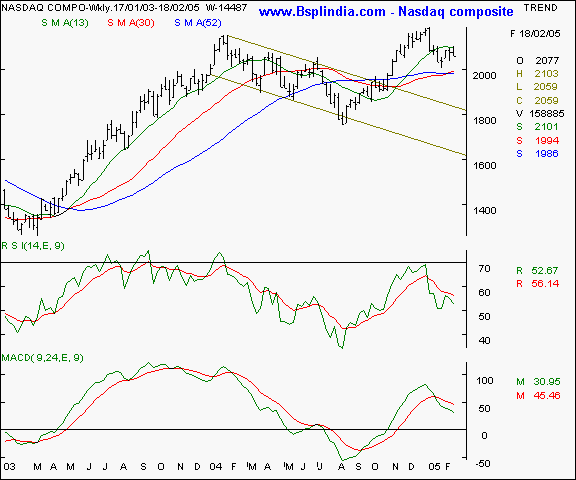
Nasdaq - this technology laden index is showing signs of resistance at the 2100 - 2105 levels, which it must surpass if the congestion / resistance is to be overcome and a positive reversal is witnessed. On the lower side, expect minor support at the 2020 levels.
Your call of action - Since Indian investors are not allowed to trade in overseas markets, this is a pure academic study.
Arvind Mills I BEL I BHEL I Grasim I ICICI Bank I Petronet LNG I NTPC I Raymonds I Tisco I Tata Power I BSE Sensex I Nifty I CNX-IT I Dow Jones I Nasdaq I FTSE I Top I Close window I Print page
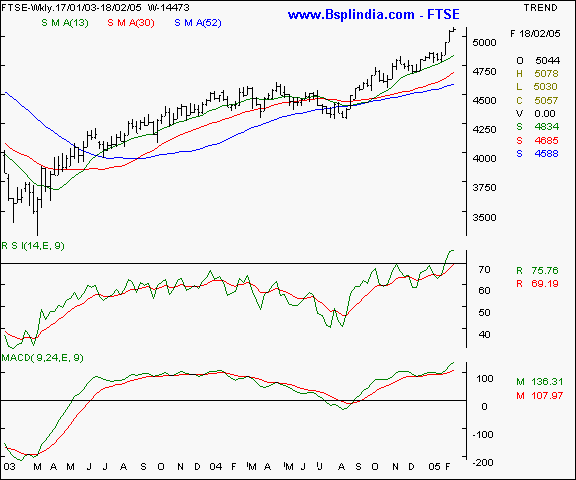
FTSE - this UK index is showing the best strength among the international indices as the graph clearly shows a breakout above the resistance levels with a rising tops and bottoms formation pattern. We expect the FTSE to test the 5120 - 5130 levels in the coming weeks in a conducive scenario and a support at the 4955 levels on the lower side.
Your call of action - Since Indian investors are not allowed to trade in overseas markets, this is a pure academic study.
Arvind Mills I BEL I BHEL I Grasim I ICICI Bank I Petronet LNG I NTPC I Raymonds I Tisco I Tata Power I BSE Sensex I Nifty I CNX-IT I Dow Jones I Nasdaq I FTSE I Top I Close window I Print page
|
Trading tips for the week |
-
The put / call ratio is climbing and is currently at the 0.35 : 1 levels and the outstanding positions in the derivatives segment have shown a quantitative increase. The FII investments are continuing steadily.
-
There is offloading at higher levels in stock futures. That indicates a cautious approach as long positions in individual stocks is being hedged by Nifty shorts.
-
The current week is crucial for the markets as the expiry, budget and IPO drain will determine the market trends hereafter.
-
The impeding expiry of the February series will see offloading and higher volatility in the near term.
-
Trades must be executed in minimal volumes due to the higher volatility expected. Trade fewer counters and conserve cash for future opportunities.
-
Standby for fresh recommendations via SMS on a real - time basis.
- Have a profitable week.
- Vijay L Bhambwani
- Ceo :- Bsplindia.com
The author is a Mumbai based investment consultant and invites feedback at Vijay@BSPLindia.com and ( 022 ) 23438482 / 23400345.
SEBI disclosure :- The author has no positions in any securities mentioned above.
- While all due care has been taken while in compiling the data enclosed herein, we cannot be held responsible for errors, if any, creeping in. Please consult an independent qualified investment advisor before taking investment decisions. This mail is not sent unsolicited, and only advisory in nature. We have accepted no consideration from any company mentioned above and recommend taking decisions on merits of the stocks from our viewpoint. This email is being sent to you as a paid subscriber. Please protect your interests and ours by not disclosing the contents to any un-authorised person/s
Legal notice :- The Professional Ticker Reader is a trademark of Bhambwani Securities (P) Ltd. and any un-authorised replication / duplication in part or full will be infringing our trademark and will result in legal action being enforced on the infringing persons / parties.
