Dow
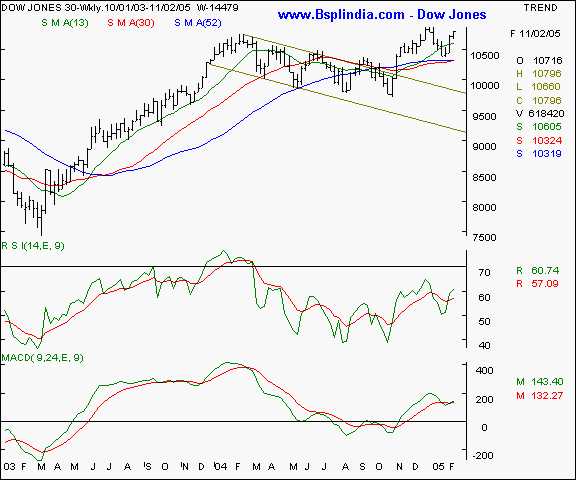
Jones Industrial Average - the Dow has managed to close higher
for the third consecutive week and that is a sign of optimism. As
advocated last week, the 10800 levels are proving to be an immediate
resistance. The 10600 will be a short term floor and the upsides will see
resistance at the 10920 in the coming week.

Your
call of action - Since Indian
investors are not allowed to trade
in overseas markets, this is a pure
academic study.
Nasdaq
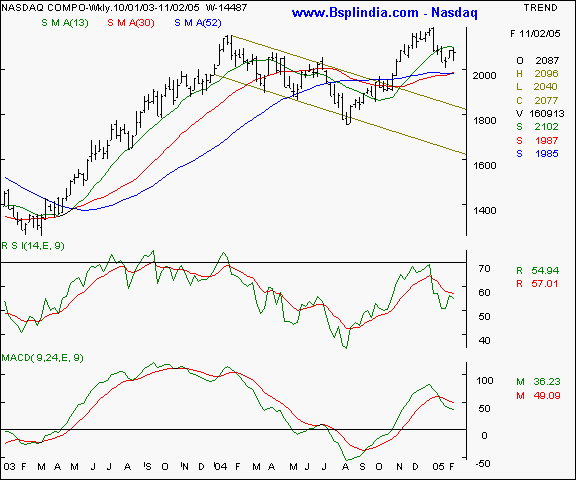
- the Nasdaq has been under pressure and is underperforming the Dow Jones
average. The 1990 levels are a strong floor and the 2115 will be a strong
short term resistance above which it must close to reverse the weak trend.

Your
call of action - Since Indian investors are not
allowed to trade in overseas markets, this is a pure academic study.
FTSE
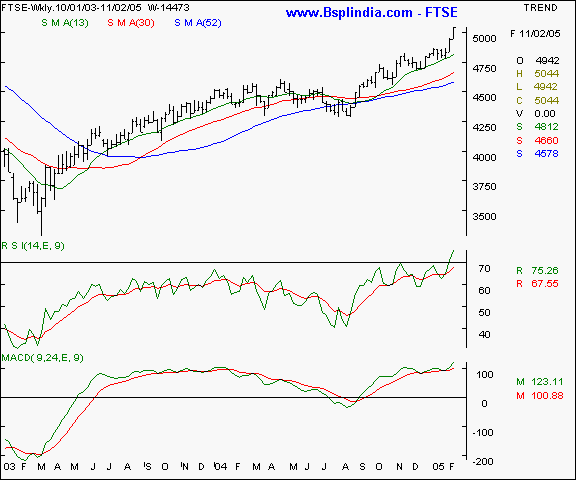
- The FTSE is by and far the strongest of the overseas indices and is
displaying signs of absolute strength as it hits a new intermediate high.
The overhead resistance is at the 5165 levels and the support at the
4980 levels.

Your
call of action - Since Indian investors
are not allowed to trade in overseas
markets, this is a pure academic study.