Global market indices - weekly feature - Feb 19, 2005
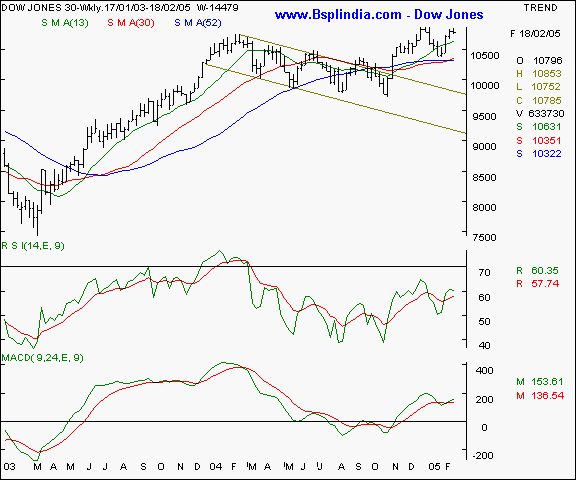
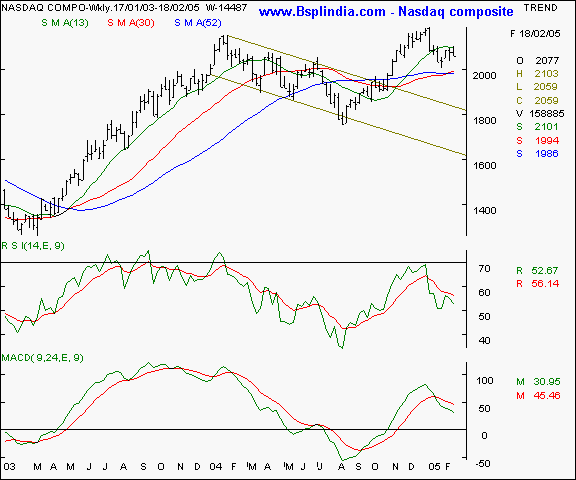
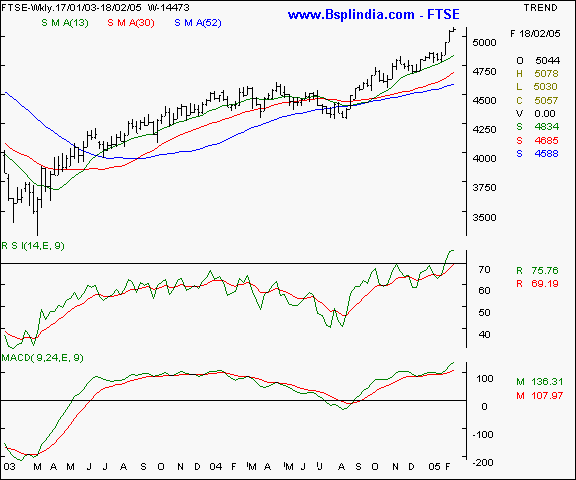
Dow Jones Industrial Average - the Dow has snapped it's 3 week gaining spree to ease off as the interest rate news has been a brake on sentiments. We expect the 10920 levels to be a major short term resistance and the support to be at the 10655 levels. Your call of action - Since Indian investors are not allowed to trade in overseas markets, this is a pure academic study. Nasdaq - this technology laden index is showing signs of resistance at the 2100 - 2105 levels, which it must surpass if the congestion / resistance is to be overcome and a positive reversal is witnessed. On the lower side, expect minor support at the 2020 levels. Your call of action - Since Indian investors are not allowed to trade in overseas markets, this is a pure academic study. FTSE - this UK index is showing the best strength among the international indices as the graph clearly shows a breakout above the resistance levels with a rising tops and bottoms formation pattern. We expect the FTSE to test the 5120 - 5130 levels in the coming weeks in a conducive scenario and a support at the 4955 levels on the lower side. Your call of action - Since Indian investors are not allowed to trade in overseas markets, this is a pure academic study. |
Your feedback is important ! Please click here to let us know your views. Click here to inform a friend about this page on our website.


