- The Professional Ticker Reader TM
- Your accurate, authentic and affordable guide to investing
Flavours of the week Aug 15, 2004
These are stocks that we expect to out-perform the markets. Cash and derivative strategies are advised thereon. Please stay online to enable loading of graphics from our servers. Please also read the trading tips section at the end of the newsletter.
|
Individual stocks. |
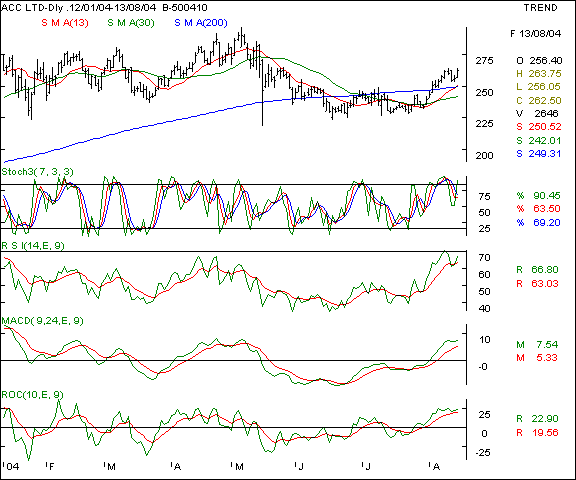
ACC - this cement bell weather stock was recommended last week as a trading buy and yielded the desired results. The counter has been a market out-performer in the recent past and is showing signs of strength on the charts. The momentum oscillators are pointing towards an upmove and the 265 levels are likely to be the short term hurdle for this counter. The scrip has been trading above the short and long term averages and the short term signals are bullish. We recommend a trading buy on a breakout in small quantities.
Your call of action -
-
Investors / cash segment players - we recommend a buy above the 265 in small / minimal quantities with a stop loss at the 255 mark. The immediate minor hurdle is expected to be at the 270 mark, where part of the longs can be liquidated. The upper most expectation will be the 275 - 77 mark. It should be remembered the market outlook being bearish in the coming week, the exposure on long trades must be limited. Traded volumes on the NSE on a breakout should ideally be over 40 lakh shares in the entire session.
-
Aggressive F&O traders - Buy the August futures above a breakout of the 266 levels with sustained trading above this level with heavy volumes. Maintain a stop loss at 262 and expect to book profits at the 270 levels. In a conducive market, expect the 272 - 273 levels to be a possibility. Income players can sell the August 230 puts at a suggested premium of Rs 0.50 and above in minimum lots.
-
Derivatives contract size - Market lot = 1500 shares, F&O margins = approx Rs 65,000 ( subject to change daily ).
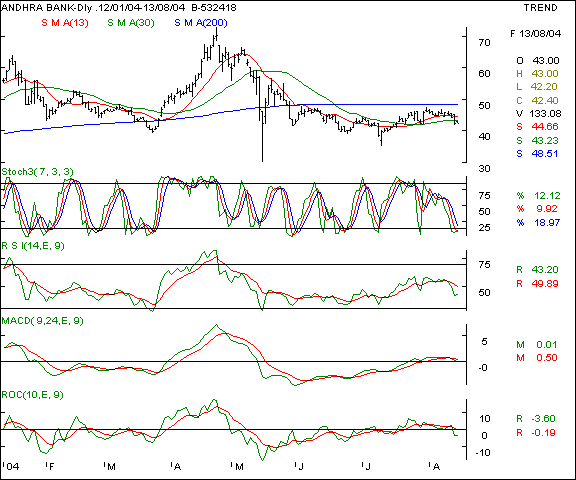
Andhra Bank - this PSU banking scrip is witnessing selling pressure at higher levels as the counter is making lower tops and bottoms formations. The scrip has not managed to close above it's 200 DMA after May 2004 and has been an under-performer in the markets. The oscillators are indicating an advance breakdown signal which will be confirmed as and when the scrip breaks the 40 support. We recommend a trading sell / short sell on the counter.
Your call of action -
-
Investors / cash segment players - n/a.
-
Aggressive F&O traders - short the August futures when a close below the 41 is achieved with higher volumes. Maintain a stop loss of 43 and a profit target of 38 in the near term and 35 in a weak / rapidly falling market. Income players can sell the August 50 calls at a premium of Rs 0.30 - 0.35 in small lots only
-
Derivatives contract size - Market lot = 4,600 shares, F&O margins = approx Rs 43,000 ( subject to change daily ).
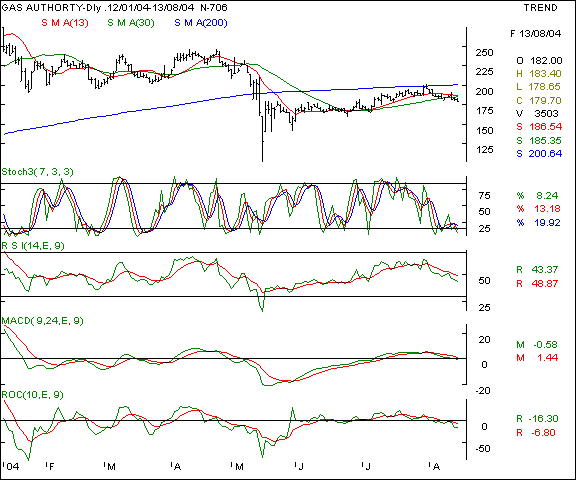
GAIL - this PSU gas pipeline major is showing signs of temporal weakness as the three month period of consolidation has seen the scrip unable to surpass the 200 day SMA. Of late, the counter has been making lower tops and bottoms, the averages are turning lower and the oscillators are in the sell mode. The scrip is likely to turn bullish only if it manages to close above the 200 DMA and that too with very heavy volumes. The sentiments have taken a beating due to the news of the competition coming from Reliance Industries and the spiraling international crude prices. A close below the 175 levels will see a distinct bearishness come over the counter. We recommend a sell / short sell on this confirmatory fall.
Your call of action -
-
Investors / cash segment players - do not hold long positions if the counter falls below the 175 levels with heavy volumes.
-
Aggressive F&O traders - Short sell the Aug futures if a close below 175 is seen, maintain a stop loss at the 178 levels and expect the first target of 172 in the near term. In a conducive market, even 168 - 170 levels are possible. An alternate strategy for a lower risk profile investor would be - Sell the Aug futures below the 175 mark, and buy the Aug 190 calls below the Re 2 mark, thereby reducing the profit potential by Rs 2 but hedging the risks. Returns conscious players can sell the Aug 210 calls at a premium of Rs 0.65 or above in small lots.
-
Derivatives contract size - Market lot = 1,500 shares, F&O margins = approx Rs 55,000 ( subject to change daily ).
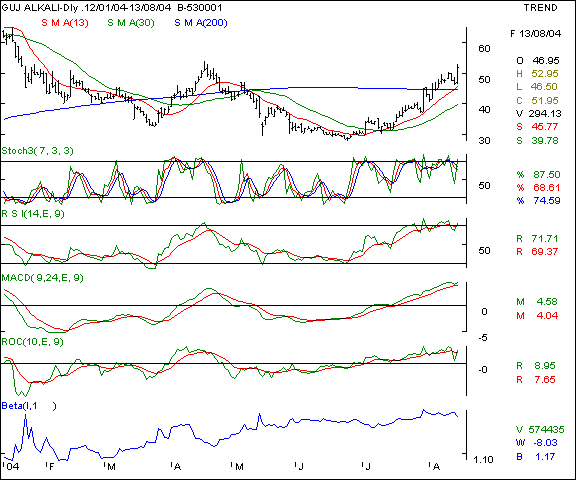
Gujurat Alkali - this counter was recommended last week and the week prior, with excellent results. The counter is showing great resilience and market out-performing strength as the chart shows. The 200 day SMA has been surpassed and the short term averages are indicating further strength. The momentum oscillators are in a buy / hold mode and the stock is nearing the 8 month highs at the 54 levels. Should this level be surpassed, the scrip will attract further buying. The counter has a beta factor of 1.17 and therefore likely to continue out-performing the indices. We recommend a buy.
Your call of action -
-
Investors / cash segment players - Buy the counter at current levels and maintain a stop loss at the 44 mark, liberal investors may even hold till the 42 levels. Once the 54 levels are surpassed, we expect the 60 levels to be achieved. Over a longer period, in a conducive market, higher levels of 64 can be expected. Buy in small / medium lots.
-
Aggressive F&O traders - N/a
-
Derivatives contract size - N/a.
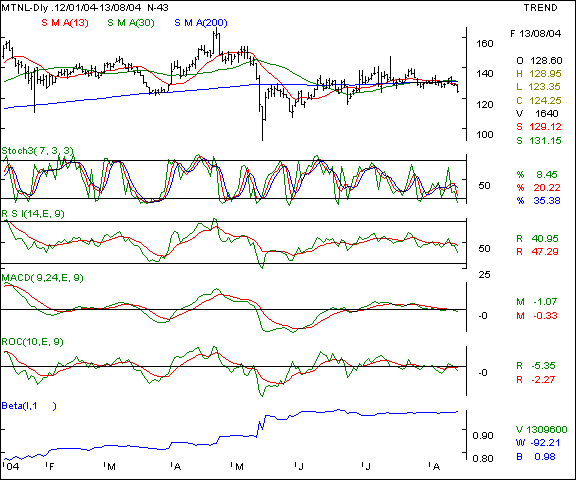
MTNL - This counter has a lower than average relative strength and beta factor. That implies a faster fall than the BSE Sensex whenever the markets tank lower. The stock tends to move in a narrow band between the 143 and the 120 band since the last quarter and is now displaying signs of weakness. The oscillators are pointing towards an advance breakdown signal as the price graph falls below the SMA's and the averages themselves are falling. The strategy suggested is multi pronged - a hedged short position or a naked call option writing one for the income investors.
Your call of action -
-
Investors / cash segment players - n/a.
-
Aggressive F&O traders - Short the Aug futures at the 127 levels and hold with a stop loss at the 130 levels. Expect to book profits at the 120 - 121 levels in the near term. Alternately, sell the August 140 calls at Rs 2.60 premium in small lots.
-
Derivatives contract size - Market lot = 1,600 shares. F&O margin = approx Rs 37,000 (subject to change daily )
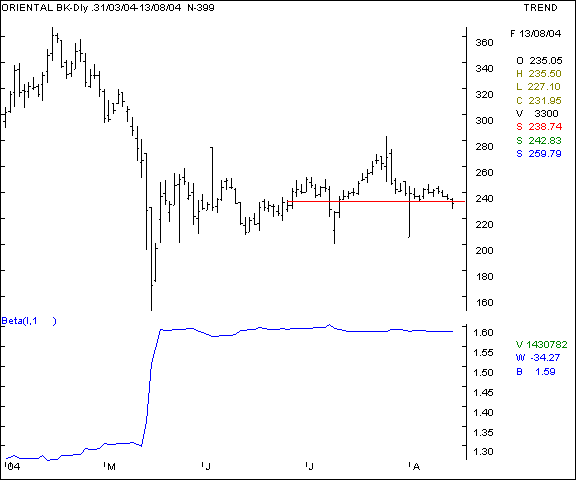
Oriental Bank of Commerce - this banking PSU has been in the limelight and has one of the lowest NPA's on record. The scrip has been moving sideways of late and is making lower tops and bottoms formation. The banking sector is reeling from an unloading bias and the recent defaults by GTB and a clutch of co-operative banks is not helping the sentiments any better. Traders may please note that this counter has a high beta of 1.59 ( which means that for every 1 % movement in the index, this counter will move 1.59 % ) and therefore likely to fall faster in a weak market. The graphic below shows a rough and ready triple bottom, which can become a head and shoulder pattern if the counter falls and closes below the 225 levels on a continous basis.
Your call of action -
-
Investors / cash segment players - n/a
-
Aggressive F&O traders - Short the September futures when the spot prices fall below the 225 levels with high volumes of 17 lac shares and above on the NSE. Hold with a stop loss of Rs 6 and expect the price to fall to the 218 - 220 in the near term. Income traders can sell the Aug 260 calls at a premium of Rs 1.20 or above.
-
Derivatives contract size - Market lot = 1,200 shares, F&O margins = approx Rs 63,000 ( subject to change daily ).
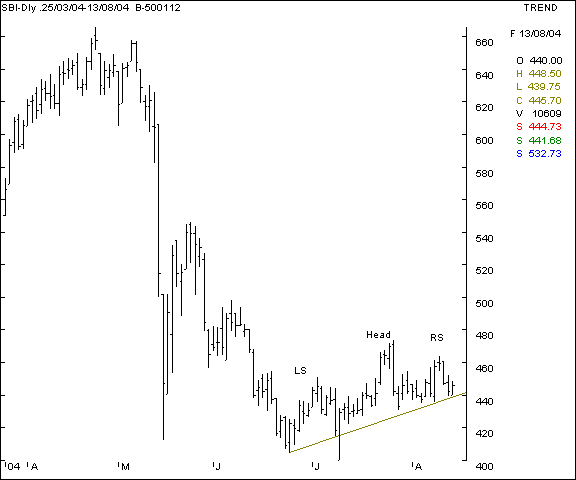
SBI - this PSU banking major has been making higher bottoms along the bullish trendline shown in the graphic below. It maybe noted that this 7 week formation will be a confirmed head and shoulder pattern ( bearish implications ) if the scrip closes below the 435 mark with volumes over 50 lac shares on the NSE. The head and shoulder pattern is marked on the graphic below, but needs to be confirmed by the breakdown in price and volume action as specified above. Only then, must the traders short sell the counter.
Your call of action -
-
Investors / cash segment players - n/a.
-
Aggressive F&O traders - Short the September futures if the cash closes below 435. The rate specified is spot as the Sept futures are quoting at Rs 6 premium to cash and the cost of carry will vary as the August expiry approaches. Hold with a protective stop loss at the 445 levels in spot and expect the 415 - 420 levels in the short / medium term. Income players can sell the August 490 calls at a premium of Rs 1.50 in minimal lots only.
-
Derivatives contract size - Market lot = 500 shares. F&O margin = approx Rs 41,000 (subject to change daily )
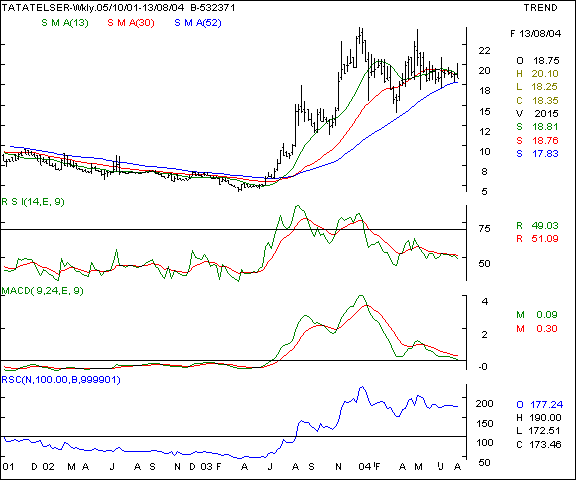
Tata Teleservices - this telecom player in the Maharashtra circle is expanding rapid and a massive re-structuring of operations is underway. There are plans of Rs 1,700 crs capex and a possible rights issue, which will entitle the existing share holders to enhance their stake in this company at discounted rates. We have been recommending this counter since a few months and the outlook remains unchanged for the long term player. We advocate a hold / buy on this scrip.
Your call of action -
-
Investors / cash segment players - Buy the counter at the 17 levels and hold with a stop loss at the 14 levels. Existing players may hold their positions with a similar stop loss. On the upsides, expect a level of Rs 22 in the short term.
-
Aggressive F&O traders - n/a.
-
Derivatives contract size - n/a
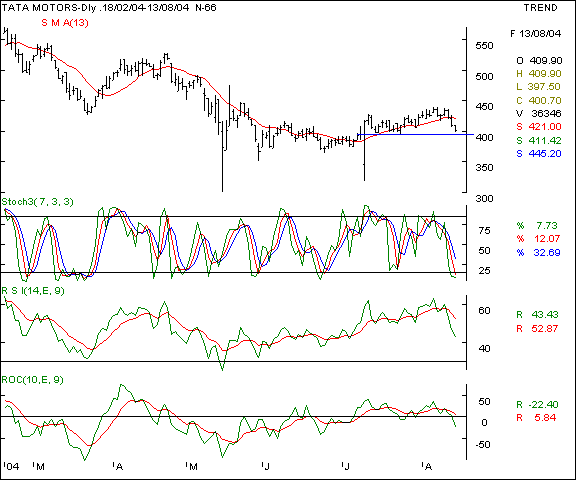
Tata Motors - this counter has been moving in a bullish groove for a short period as the chart indicates. That period of higher tops and bottoms has terminated and the counter is trading below it's short term DMA. The immediate support is at the 396 levels and the oscillators are pointing towards that support being violated in the near term. A sustained closing below the 396 levels will see the scrip headed towards the 370 - 375 mark.
Your call of action -
-
Investors / cash segment players - n/a
-
Aggressive F&O traders - short the September futures below the 400 mark and hold with a stop loss at the 405 levels, expecting to book profits at the 394 levels in the short term. In a falling market, even lower levels are possible. Income players can sell the August 460 calls at a suggested premium of Rs 1.70.
-
Derivatives contract size - Market lot = 825 shares, F&O margins = approx Rs 61,000 ( subject to change daily ).
|
Indices - domestic |
BSE Sensex - this benchmark is exhibiting weakness as the chart shows a lower tops / bottoms formation. The index made a bar reversal on Wednesday ( Aug 11, 2004 ) at the 5269 levels, which will be the immediate hurdle for the index on the upsides. Only above this level on a sustained closing basis will the index manage to climb higher. Even then, the upsides will be limited to the 5350 levels ( if such an upmove occurs in the entire month ). On the lower side, expect minor support at the 5050 levels which is also the 30 day SMA. Should the Sensex close below this mark, expect a rapid fall to the 5015 levels. Take a fresh view beyond these levels.
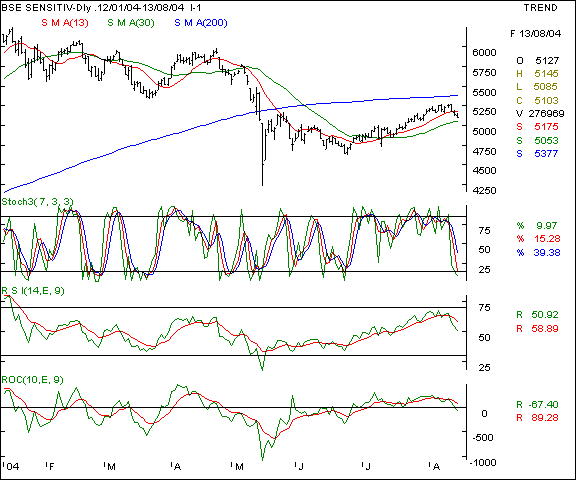
Your call of action - Since the Sensex futures are not very liquid, we suggest trading the Nifty 50 instead.
Nifty 50 - this NSE benchmark is showing signs of weakness similar to the BSE Sensex and has been unable to surpass the 1659 levels - which is a crucial threshold level. The 1587 levels will be the immediate minor support and any fall below this level with high volumes will mean the 1560 levels will be a possibility. The momentum oscillators are pointing towards a fall and the breakdown below the 1587 will be a confirmatory signal for short sellers to initiate sales.
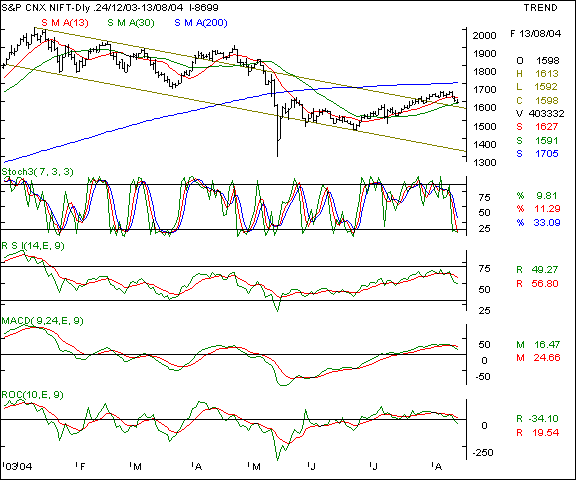
Your call of action - Short sell the August futures below the 1588 levels if the volumes on the fall are higher. The stop loss should be 1596 and the downward target will be the 1579 levels and then the 1566 in a conducive market. Income players may sell the Aug 1660 calls at a suggested premium of Rs 6.25 or above in small lots or the Aug 1670 calls at a suggested premium of Rs 4.50 or above in slightly bigger lots.
|
Indices - international |
Dow Jones Industrial Average - this NYSE benchmark has been advocated by us as being bearish. Notice the lower tops since November 2003 and the subsequent bottoms being lower too. The 9800 levels are a crucial support to watch out for and should a sustained close below the 9800 be achieved, expect the 9600 levels to materialise. On the higher side, expect the resistance to be stiff at the 9970 levels.
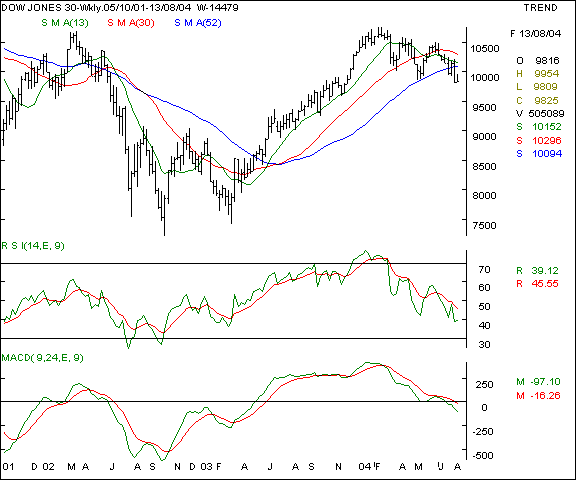
Your call of action - Since Indian investors are not allowed to trade in overseas markets, this is a pure academic study.
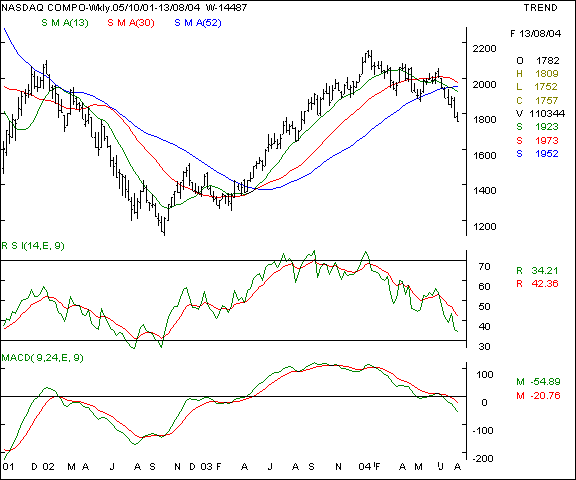
Nasdaq - this technology heavy index is weaker than the Dow Jones and is making rapid falls as the lower bottoms formation shows. The 1840 levels having been violated, the outlook is weak on this index. The upsides will be capped at the 1830 levels and we expect the 1700 levels to be tested in 3-5 weeks, all things remaining the same.
Your call of action - Since Indian investors are not allowed to trade in overseas markets, this is a pure academic study.
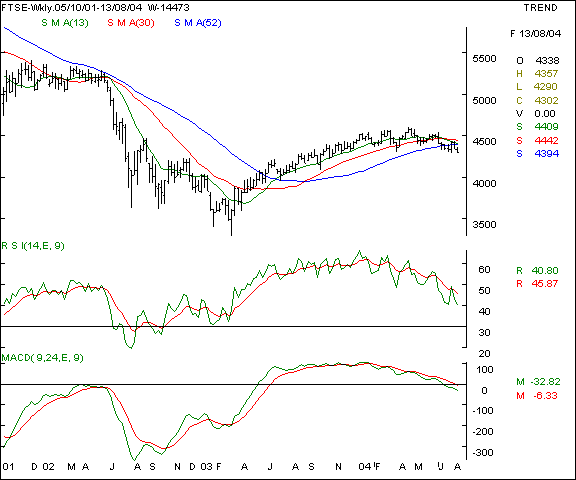
FTSE - this UK benchmark index is showing slightly higher relative strength as compared to the Dow Jones. The oscillators are signaling an advance breakdown formation and the same will be confirmed if the index closes below the 4250 levels with higher volumes. This index can test the 4120 levels in 3 - 5 weeks, all things remaining equal.
Your call of action - Since Indian investors are not allowed to trade in overseas markets, this is a pure academic study.
|
Trading tips for the week |
-
The put / call ratio is steady and is currently at the 0.32 : 1 levels and the outstanding positions in the derivatives segment have shown a qualitative deteteoration. The FII investments are turning negative. The unwinding of positions is particularly negative and is indicating bearishness in the undertone.
-
There is offloading at higher levels in stock futures. That indicates a cautious approach as long positions in individual stocks are being pared by bulls. Though a significant rise is seen in the calls segment, that shows a defensive approach by bulls.
-
High crude oil prices remain the major concern and if the domestic prices of petrol / diesel are hiked, the markets are likely to turn extremely nervous.
-
The index heavy-weights are showing fatigue again. This in turn will drag the indices and cause a nervousness in the undertone.
-
The impeding expiry of the August series will see offloading and higher volatility in the near term, especially of the markets continue to sink.
-
Trades must be executed in small volumes due to the higher volatility expected. Trade fewer counters and conserve cash for future opportunities.
-
Standby for fresh recommendations via SMS on a real - time basis.
- Have a profitable week.
- Vijay L Bhambwani
- Ceo :- Bsplindia.com
The author is a Mumbai based investment consultant and invites feedback at Vijay@BSPLindia.com and ( 022 ) 23438482 / 23400345.
SEBI disclosure :- The author has no positions in any securities mentioned above.
- While all due care has been taken while in compiling the data enclosed herein, we cannot be held responsible for errors, if any, creeping in. Please consult an independent qualified investment advisor before taking investment decisions. This mail is not sent unsolicited, and only advisory in nature. We have accepted no consideration from any company mentioned above and recommend taking decisions on merits of the stocks from our viewpoint. This email is being sent to you as a paid subscriber. Please protect your interests and ours by not disclosing the contents to any un-authorised person/s
Legal notice :- The Professional Ticker Reader is a trademark of Bhambwani Securities (P) Ltd. and any un-authorised replication / duplication in part or full will be infringing our trademark and will result in legal action being enforced on the infringing persons / parties.