- The Professional Ticker Reader TM
- Your accurate, authentic and affordable guide to investing
Flavours of the week Aug 28, 2004
These are stocks that we expect to out-perform the markets. Cash and derivative strategies are advised thereon. Please stay online to enable loading of graphics from our servers. Please also read the trading tips section at the end of the newsletter.
|
Individual stocks. |
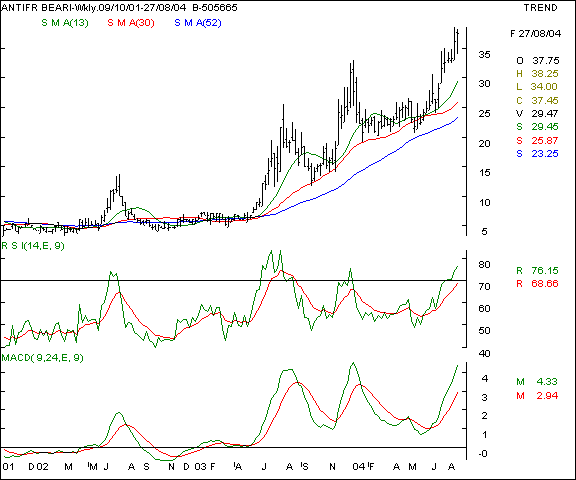
Anti friction Bearings - this bearings manufacturer is a mid-cap story that offers stable investment opportunity. The chart pattern suggests a higher tops and bottoms formation with a positive confirmation on the oscillators and steady traded volumes. The recent price cut by the steel companies is a positive trigger for the stock as the lower input costs will add to the bottomline. We recommend a buy on the counter on declines.
Your call of action -
-
Investors / cash segment players - Buy the scrip on declines to the 32 - 33 levels and hold with a stop loss at the 29 mark. Expect a price of 46 - 50 levels in 6 - 8 months time frame. Buy small lots as the scrip is not highly liquid.
-
Aggressive F&O traders - derivatives n/a
-
Derivatives contract size - n/a.
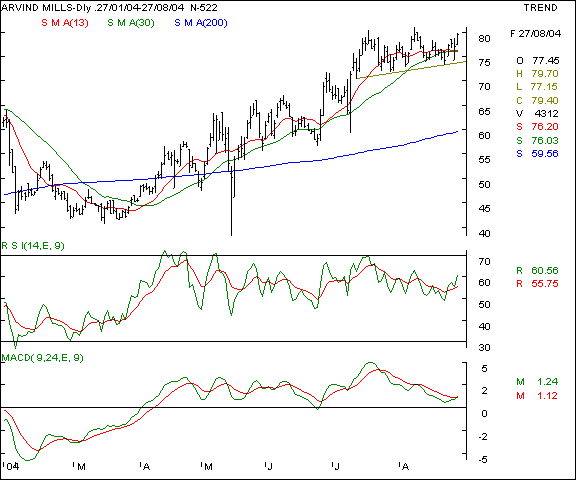
Arvind Mills - This scrip has been recommended by us frequently in the recent past and has been living up to it's expectations. The major positive has been the lower cotton prices due to a good crop. This company is a large player in the international denim market and cotton prices are a major factor in the company's profitability. The scrip is making higher tops as the graphic shows as under. The oscillators are indicating a bullishness in the undertone. We recommend a buy on declines with a medium term perspective for safer returns.
Your call of action -
-
Investors / cash segment players - buy the scrip for delivery at the 75 - 77 levels and hold with a stop loss at the 71 levels. We expect the 84 levels to be a short / medium term possibility. In the longer term, higher levels are possible.
-
Aggressive F&O traders - Buy the September futures at the 78 levels and hold with a stop loss at the 75 levels. Expect to book profits at the 84 - 85 levels partly and exit completely at the 87 levels. Income players can sell the Sept 70 puts at a premium of Rs 0.85 or above. Lower risk profile players can attempt selling the Sept 65 puts at a premium of Rs 0.75
-
Derivatives contract size - Market lot = 4,300 shares, F&O margins = approx Rs 64,000 ( subject to change daily ).
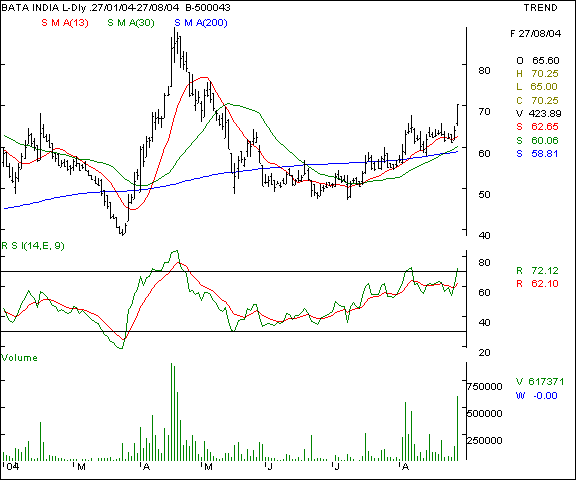
Bata - This footwear major is showing signs of strength as the chart pattern indicates. The scrip shows a rounding bottoms formation as the upmove is accompanied by heavy volumes. The RSI is showing strength as the stock makes consistent higher tops and bottoms formation and is a buy on declines.
Your call of action -
-
Investors / cash segment players - Buy the scrip in small lots on declines to the 66 levels and hold with a stop loss at the 61 levels. Expect to book profits at the 74 - 77 levels in the medium term.
-
Aggressive F&O traders - F&O n/a.
-
Derivatives contract size - F&O n/a.
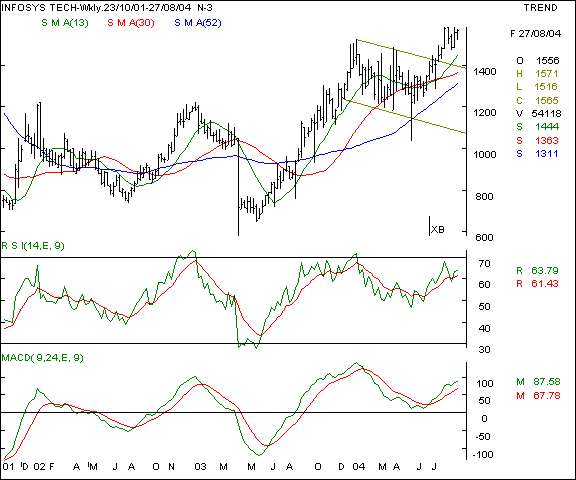
Infosys - This software bell-weather is in an intermediate uptrend and is out-performing the markets since the rally started last year. The stock has signalled a breakout above the 1420 levels and that fact has been pointed out by us in the previous editions. The upper target is the 1600 - 1620 levels in the near to medium term. The oscillators are showing strength in the undertone and the bullishness in the Nasdaq over the weekend is a positive trigger for the sector.
Your call of action -
-
Investors / cash segment players - buy the scrip for delivery at declines of 1550 levels and hold with a stop loss at the 1515 levels. Expect 1600 to be the immediate target on the upsides.
-
Aggressive F&O traders - Buy the September futures on declines to the 1562 levels and hold with a stop loss at the 1530 mark. Expect to book profits at the 1595 - 1610 levels in the short / medium term
-
Derivatives contract size - Market lot = 200 shares. F&O margin = approx Rs 52,000 (subject to change daily )
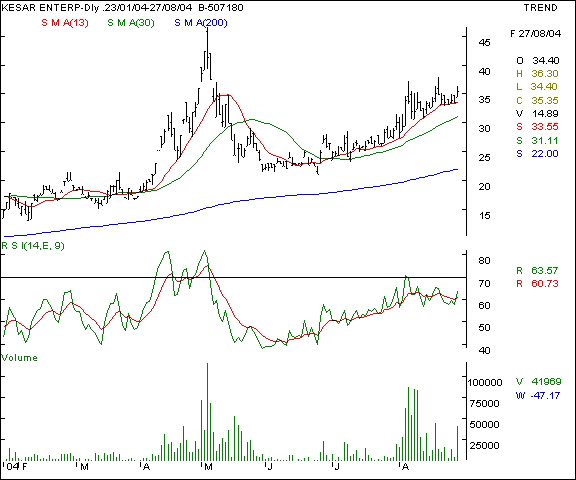
Kesar Enterprises - This is another mid cap story that we have recommended in the past. The recent sugar sector re-rating has seen a trickle down effect on this scrip too and the share has been a multi bagger in the short term. Currently consolidating with good volumes, a breakout above the 38 mark will see a positive impact on the scrip price. We recommend a buy at that confirmatory breakout.
Your call of action -
-
Investors / cash segment players - buy the scrip in small lots above the 38 levels with a stop loss at the 33 levels. The upper target should be at the 45 mark in a few months in a conducive market as long as there are no changes in policy matters.
-
Aggressive F&O traders - F&O n/a
-
Derivatives contract size - F&O n/a
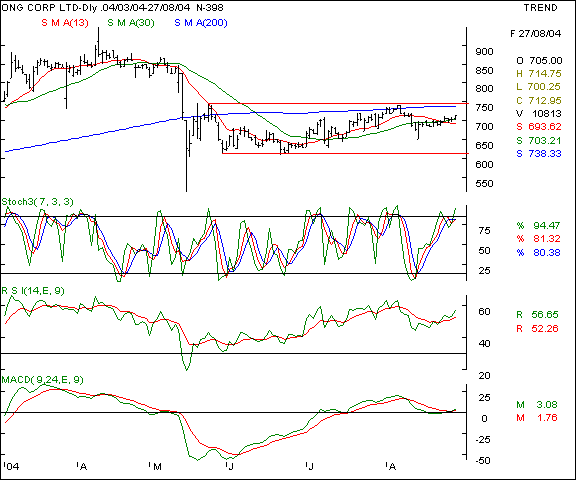
ONGC - This PSU oil and gas major is showing signs of bullish consolidation as the chart depicts below. The momentum oscillators are pointing towards a rally and the scrip is now trading above it's short term averages. The scrip being heavily weighted in the indices, is likely to lend a boost the markets on the whole and improve sentiments in the near term. We recommend a hold on earlier purchases and buy on slight rallies.
Your call of action -
-
Investors / cash segment players - Buy the scrip above the 715 levels and hold with a stop loss at the 704 levels. Expect to book profits at the 729 atleast partially and at the 738 - 742 completely in a conducive market scenario.
-
Aggressive F&O traders - Buy the September futures above the 710 levels, hold with a stop loss at the 702 mark and expect profit taking at the 722 levels in the near term.
-
Derivatives contract size - Market lot = 300 shares. F&O margin = approx Rs 35,000 (subject to change daily )
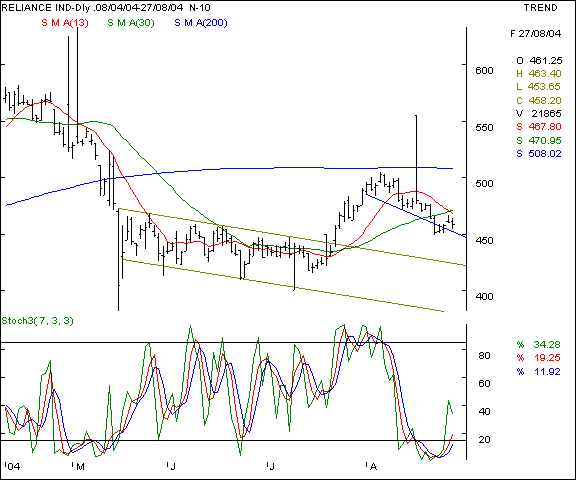
Reliance Industries - this scrip is a market mover in terms of sentiments and has been an under-performer in the recent sessions as the chart indicates. The stock is trading along the downward sloping trendline and is below it's short term averages. We expect a technical bounceback from the 450 levels and recommend a speculative buy on the counter for higher risk profile traders.
Your call of action -
-
Investors / cash segment players - Buy the scrip in very small lots only at the 450 mark and hold with a stop loss at the 444 levels. Expect to book profits at the 464 levels in the near term.
-
Aggressive F&O traders - Buy the September futures at the 460 levels and hold with a stop loss at the 456 - 7 levels. Expect profit taking at the 465 - 66 levels. Income players can sell the September 510 calls at a suggested premium of Rs 3 and above.
-
Derivatives contract size - Market lot = 600 shares. F&O margin = approx Rs 47,000 (subject to change daily )
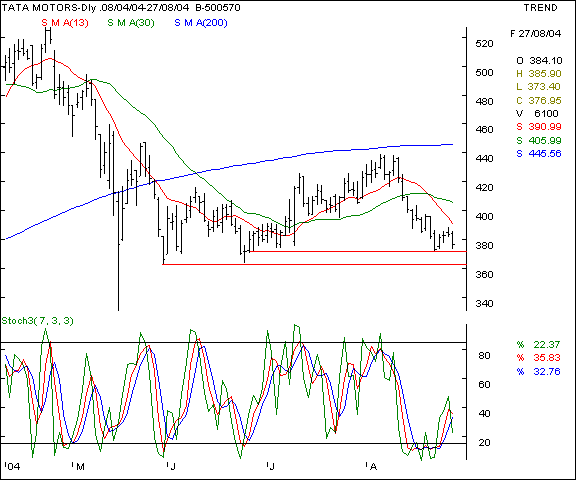
Tata Motors - this counter has been advocated by us as a short sell in the daily edition and was also covered in the previous weeks edition. The scrip is nearing support levels as shown below by the two parallel trendlines. The termination of the truckers strike will also boost sentiments as the sector saw a bear hammering due to production loss fears. A buy on declines is advocated for the coming week.
Your call of action -
-
Investors / cash segment players - buy for delivery in very small lots at the 373 levels and hold with a stop loss at the 365 levels. Expect profit taking at the 382 - 384 mark in the near term. Since the buying is based on technical considerations, quantities should be restricted.
-
Aggressive F&O traders - Buy the September futures at the 377 levels and hold with a stop loss at the 372 levels. Expect to book profits at the 385 levels in the near term in a conducive market.
-
Derivatives contract size - Market lot = 825 shares, F&O margins = approx Rs 54,000 ( subject to change daily ).
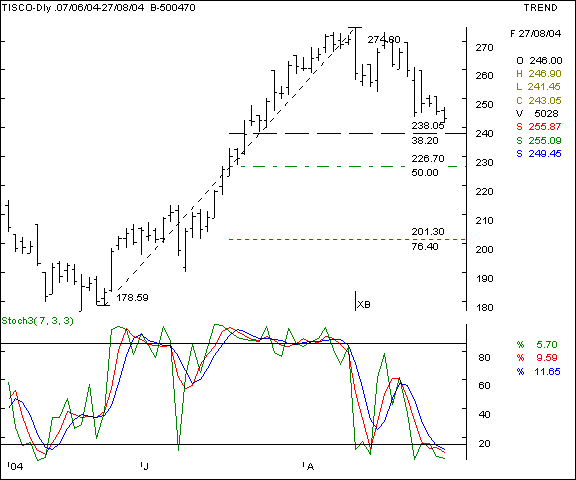
Tisco - this counter has been in the trader focus since a few weeks and has created landmarks of sorts along the way. The outstanding open interest has been the highest on this counter for weeks on end and traded volumes have been one of the highest. The recent announcement of cutting down steel prices has had a dampening effect on the share prices and what's more, the product prices are unlikely to rise before April 2005. The chart shows a retracement in the share prices and the retracement pattern marking suggests a short term floor being reached. We recommend a speculative buy for the higher risk appetite players.
Your call of action -
-
Investors / cash segment players - buy the scrip at the 238 - 240 mark and hold with a stop loss at the 233 levels. Expect profit taking at the 246 levels in a conducive market in the short term. Should the markets be unduly firm, expect the 252 levels to be a possibility.
-
Aggressive F&O traders - Buy the September futures at the 242 levels and hold with a stop loss at the 238 levels. Expect profit taking at the 248 mark in a conducive market in the short term. It must be remembered that this is a speculative buy and therefore quantities must be curtailed to the minimum.
-
Derivatives contract size - Market lot = 1350 shares, F&O margins = approx Rs 64,000 ( subject to change daily ).
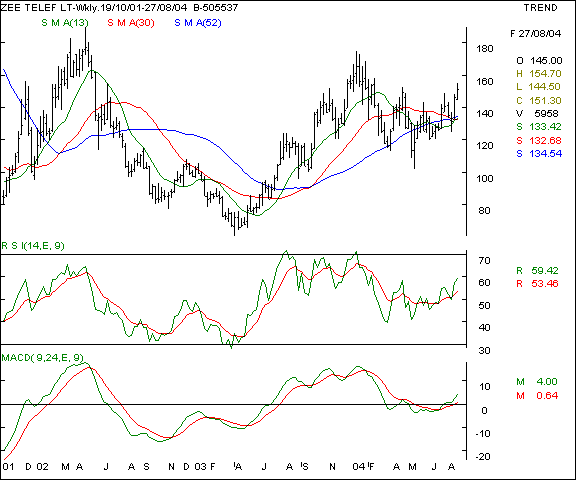
Zee Telefilms - This media stock is witnessing buying momentum as the sector itself is buzzing. The scrip has managed a strong close on a week-on-week basis and above an immediate congestion level. The main trigger will be the bid for the telecast rights to the cricket matches. High risk players can buy in small / medium sized lots for the short term.
Your call of action -
-
Investors / cash segment players - Buy the scrip at the 150 mark with a stop loss at the 144 levels. Expect to book profits at the 163 levels in a conducive market. This being a higher risk recommendation, quantities should be curtailed.
-
Aggressive F&O traders - F&O n/a
-
Derivatives contract size - F&O n/a.
|
Indices - domestic |
BSE Sensex - The Sensex is moving in an upward sloping channel on the short term charts and near it's support levels at the 5070 mark. Any close above the 5160 levels will be a bullish trigger for the index and will see the 5250 levels as a possibility. A fall and close below the channel bottom ( 5050) with high volumes will be a sign of weakness.
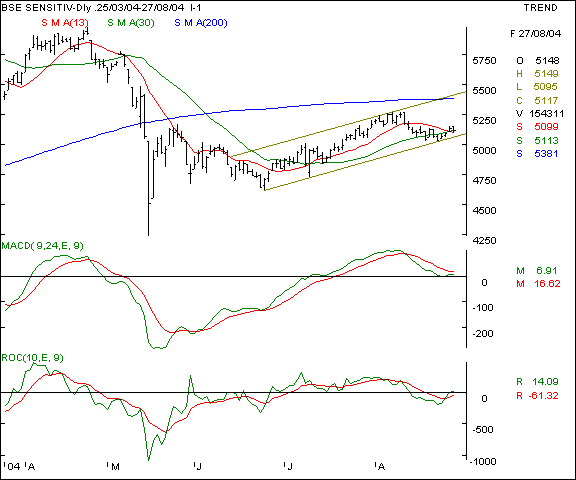
Your call of action - Since the Sensex futures are not very liquid, we suggest trading the Nifty 50 instead.
Nifty 50 - The Nifty is attempting to make a higher tops and bottoms formation and a closing above the 1600 levels has been a positive indicator. The index once trades above the 1622 levels will gain upward momentum and is likely to touch the 1640 levels in this week itself. We recommend a buy for the futures traders and watch the 1582 levels during the coming week for strong support in the near term.
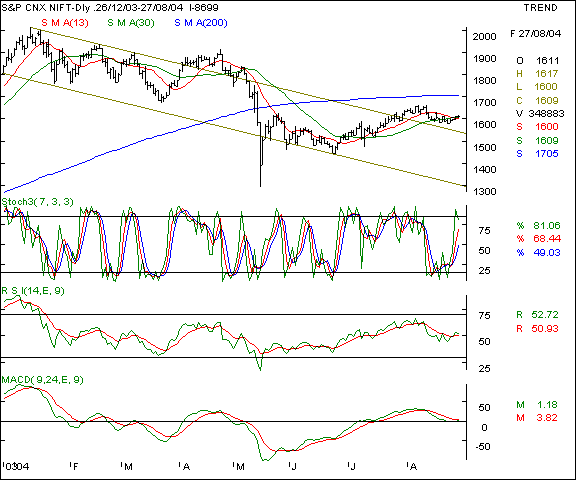
Your call of action - Buy the September futures at the 1600 - 1604 levels with a protective stop loss at the 1592 levels. Expect profit taking at the 1622 - 1625 in the near term. In the event of an exceptionally firm market, expect higher levels upto the 1632 levels. Curtail traded volumes for now.
|
Indices - international |
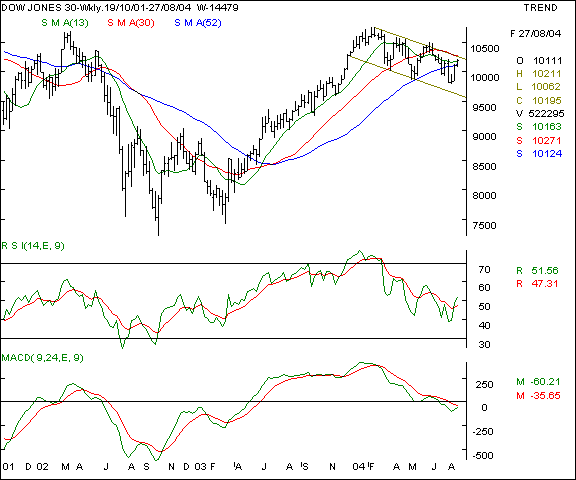
Dow Jones Industrial Average - this NYSE benchmark is moving in a bearish channel and near it's short term resistance at the 10,275 mark. The index has risen for the second week in a row and the upmove is accompanied by poor volumes. An interesting chart pattern is underway and the same will be confirmed only above the 10,320 levels which will turn the outlook to positive in the near term. Expect 10110 to be the immediate support.
Your call of action - Since Indian investors are not allowed to trade in overseas markets, this is a pure academic study.
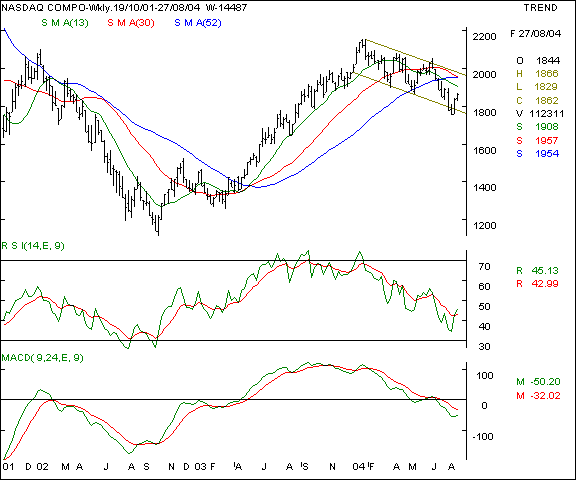
Nasdaq - This technology laden index is showing a similar pattern like the Dow Jones, only that this index is relatively weaker. The 1920 levels will be the crucial resistance to watch for now and lower support will come at the 1788 levels. Any close above the 1900 mark will boost the domestic technology stocks in the short term.
Your call of action - Since Indian investors are not allowed to trade in overseas markets, this is a pure academic study.
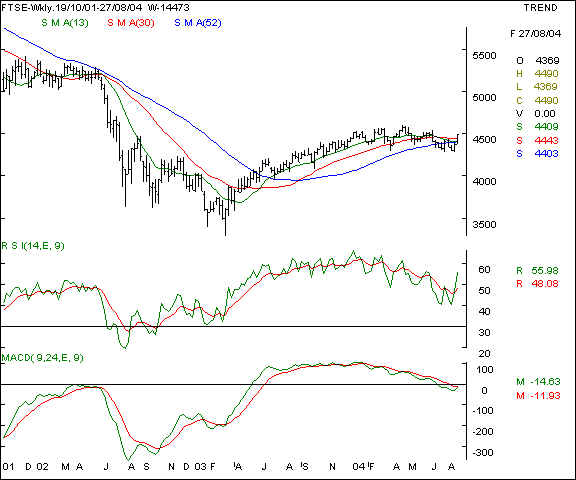
FTSE - This index is showing signs of an upward breakout and higher relative strength as compared to the US indices. The coming week will see the test of the upmove and whether the same is sustainable or not. Any close above the 4620 will be a sign of strength. On the lower side, any close below the 4350 mark will see weakness.
Your call of action - Since Indian investors are not allowed to trade in overseas markets, this is a pure academic study.
|
Trading tips for the week |
-
The derivatives segment has shown a high degree of rollover of trades and that is sign of comfort for the bulls. The FII investments are continuing to be negative, though the sales are showing signs of easing off.
-
There is short covering at lower levels in Nifty futures. That indicates a limited downside in the near term.
-
The current week is likely to be bullish as the truckers strike has ended and the international crude oil prices are also down. Should that trend be maintained, the optimism is likely to sustain for now.
-
The index heavy-weights are showing strength again. This in turn will boost the indices and cause a feel good factor. The only worry is that this upbeat sentiment should continue.
-
Trades must be executed in small volumes due to the higher volatility expected. Trade fewer counters and conserve cash for future opportunities.
-
Standby for fresh recommendations via SMS on a real - time basis.
- Have a profitable week.
- Vijay L Bhambwani
- Ceo :- Bsplindia.com
The author is a Mumbai based investment consultant and invites feedback at Vijay@BSPLindia.com and ( 022 ) 23438482 / 23400345.
SEBI disclosure :- The author has no positions in any securities mentioned above.
- While all due care has been taken while in compiling the data enclosed herein, we cannot be held responsible for errors, if any, creeping in. Please consult an independent qualified investment advisor before taking investment decisions. This mail is not sent unsolicited, and only advisory in nature. We have accepted no consideration from any company mentioned above and recommend taking decisions on merits of the stocks from our viewpoint. This email is being sent to you as a paid subscriber. Please protect your interests and ours by not disclosing the contents to any un-authorised person/s
Legal notice :- The Professional Ticker Reader is a trademark of Bhambwani Securities (P) Ltd. and any un-authorised replication / duplication in part or full will be infringing our trademark and will result in legal action being enforced on the infringing persons / parties.