- The Professional Ticker Reader TM
- Your accurate, authentic and affordable guide to investing
Flavours of the week Jan 25, 2004
These are stocks that we expect to out-perform the markets. Cash and derivative strategies are advised thereon. Please stay online to enable loading of graphics from our servers. Please also read the trading tips section at the end of the newsletter.
|
Individual stocks. |
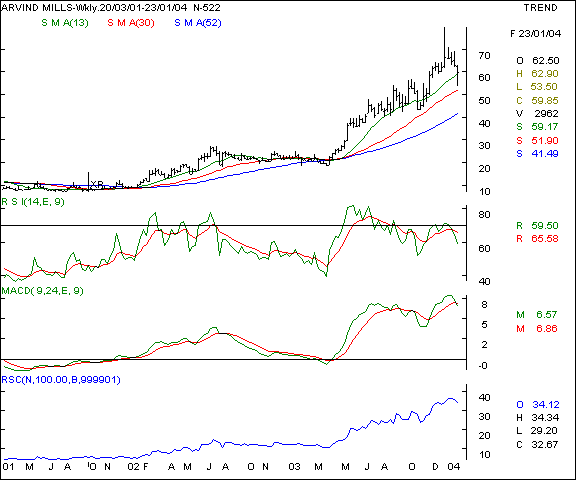
Arvind Mills - the textile major was recommended last week ( click here to view our previous editions ) at the 58 / 59 levels. The scrip is showing signs of significant strength as the stock is a market performer and is rising as news of re-structuring of the company and re-rating of the sector has changed the sentiments for the better. The stock is facing pressure as the markets are in a volatile phase recently. The immediate support at it's 30 week moving average would be a good entry point for investors with a medium term perspective. The noticeable aspect about the chart pattern is the fall being accompanied by lower volumes. That makes the selloff a result of routine profit taking rather than panic sales. We recommend a buy on declines.
Your call of action -
-
Investors / cash segment players - we advocate fresh delivery based buying into the counter at 52 / 55 with a stop loss at 48 and a target of 75 be maintained in a quarter.
-
Aggressive F&O traders - Buy the February futures on declines of 56 / 57 with a stop loss at the 52. Expect a target of 65 / 67 in a few weeks. Extra cautious players may simultaneously buy the Feb 60 puts at a maximum premium of Rs. 3.50 - 4. This strategy will ensure that your purchase cost will effectively be Rs 60. Any fall below 56 will ensure a profit from the put option and a rally above 60 will ensure a profit from the future. Your maximum loss is limited to Rs 4 per share.
-
Fixed income strategy - n/a
-
Derivatives contract size - Market lot = 4300 shares. F&O margin = Rs 1,20,000 ( subject to change daily)
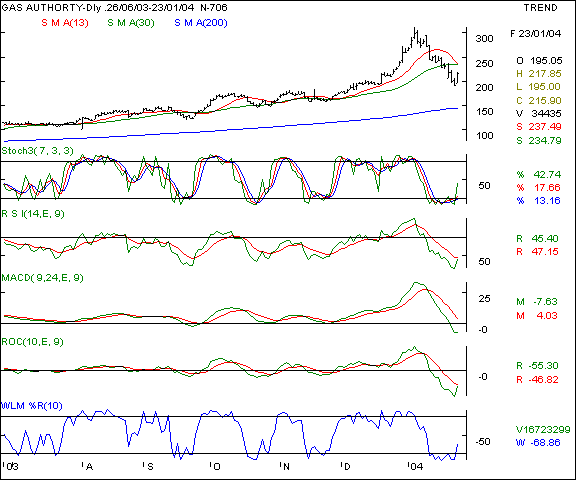
Gas Authority - this gas pipeline major has been a prolific feature of our newsletter and has been recommended vide our editions dtd 02/08/03, 09/08/03, 16/08/03, 23/08/03, 11/10/03, 01/11/03, 08/11/03, 29/11/03, 06/12/03, 13/12/03 & 18/01/04 ( click here to view our previous editions ). The stock has appreciated since then and paid rich rewards to our investors. The recent fall has been triggered by elections being announced and a result a feeling that the IPO ( initial public offering ) maybe hurried up, even at a lower price. The stock has also been over-extended and therefore a corrective fall was in order. The announcement of a final date of the IPO and road shows beginning in a fortnight is likely to cheer the stock price. The short term momentum oscillators are turning higher from oversold levels and we expect the scrip to appreciate 10 % shortly. We recommend a buy on significant declines as the outlook remains positive on the sector and stock in the medium / long term.
Your call of action -
-
Investors / cash segment players - we advocate fresh delivery based buying into the counter at levels of Rs 210 only with a stop loss at 194 and a target of 235 be maintained in the near term. In a conducive market, expect higher levels of Rs 245 / 250.
-
Aggressive F&O traders - Buy the February futures on declines of 210 ( quoting at Rs 3 premium to cash currently ), with a stop loss at the 195 levels. Expect a target of 240 in the month of February. Hedge your position by buying the Feb 200 puts at a premium of Rs 9 - 10. That will restrict your maximum loss to Rs 15 per share and raise your acquisition cost by Rs 10 to 220 ( Futures 210 + Rs 10 call premium ) levels. We feel the strategy has a fair amount of profit in it.
-
Fixed income strategy - N/a
-
Derivatives contract size - Market lot = 1500 shares, F&O margin = Rs 175000 ( subject to change daily)
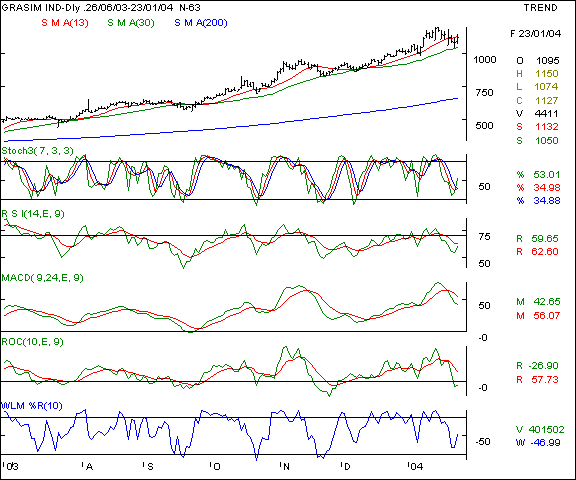
Grasim - This cement major was identified by us earlier in our editions dtd 09/08/03, 04/10/03, 01/11/03, 13/12/03 and 20/12/03 ( click here to view our previous editions ) at 700 levels and we had advocated a level of Rs 1000 - 1100 during the course of these reco's. The stock is a market out-performer and has high relative strength as compared to the indices. The scrip gets good support at the 30 day SMA, which is currently poised at the 1050 levels. Being close to the support, we do not see major declines and recommend a buy.
Your call of action -
-
Investors / cash segment players - we advocate delivery based buying into the counter at Rs 1080 - 1090 only with a stop loss at 1050 and a target of 1160 be maintained by end of this calendar quarter.
-
Aggressive F&O traders - Buy the Feb futures on declines at the 1095 levels and maintain a stop loss that 1070 levels, expecting to book profits at the 1140 levels.
-
Fixed income strategy - n/a
-
Derivatives contract size - market lot = 700 shares, F&O margins = approx Rs 1,45,000 ( margins subject to change daily )
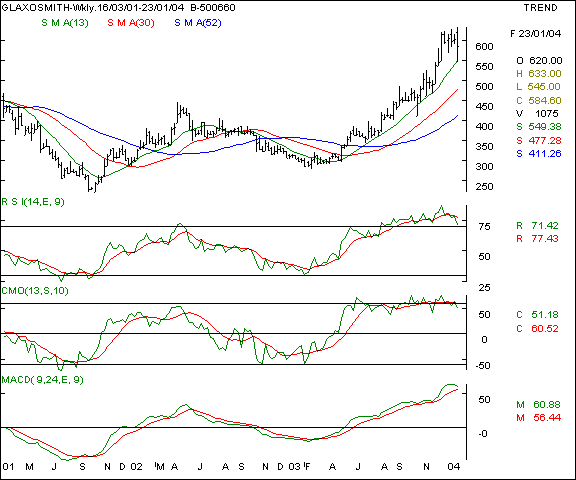
Glaxo - This MNC pharmaceuticals major has been a market out-performer as it has a relative strength of over 340 % as compared to the Sensex and has been frequently and profitably recommended in our earlier editions dtd - 14/06/03, 21/06/03, 05/07/03, 19/07/03, 15/08/03, 23/08/03, 30/08/03, 13/09/03, 20/09/03, 11/10/03, 20/12/03, 11/01/04 & 18/01/04 ( click here to view our previous editions ). Last weeks buy recommendation clicked at 580 and the stop loss was not reached, so holding those longs is advocated. We believe a higher volatility in the broader markets should see a defensive buying in the pharmaceutical stocks as the sector is seen as a safer haven for resources during turbulent markets. The main triggers will be the improved prospects for the MNC majors in the fast approaching EMR / IPR ( exclusive marketing regime / intellectual property rights regime ) as specified by the WTO, by 2005. The product patent regime will see new drug launches and higher growth impetus. The price graph is factoring / mirroring these events. We recommend a fresh buy on declines.
Your call of action -
-
Investors / cash segment players - we advocate fresh delivery based buying into the counter at Rs 560 only with a stop loss at 525 and a target of 650 - 675 be maintained by end of this calendar quarter.
-
Aggressive F&O traders - n/a
-
Fixed income strategy - n/a
-
Derivatives contract size - n/a
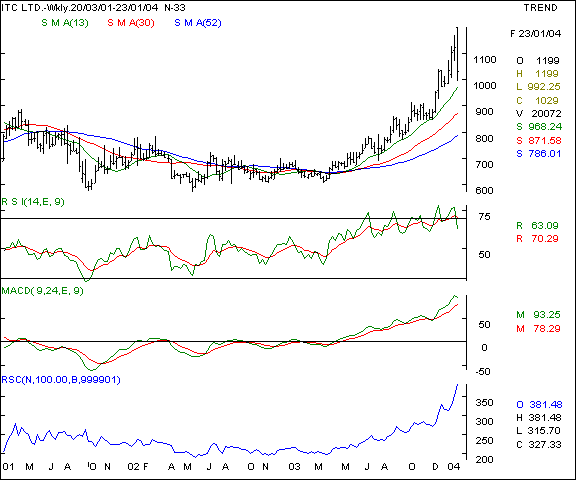
ITC - this cigarettes, hotels and FMCG major has been recommended earlier vide our editions dtd 07/06/03, 14/06/03, 21/06/03, 28/06/03, 12/07/03, 23/08/03, 30/08/03, 06/09/03 and 27/09/03 ( click here to view our previous editions ). The most noteworthy aspect of this scrip is it's high relative strength which makes it a strong counter for the patient investor. The higher beta ensures excitement for the traders. The scrip is in a new lifetime high above the 1165 levels and the recent crash has been in anticipation of the court hearing on the excise claims pending against the company. We expect a bounce back and recommend a buy on declines.
Your call of action -
-
Investors / cash segment players - we advocate delivery based buying into the counter at Rs 980 - 1000 with a stop loss at 940 and a target of 1060 be maintained by end of this month - in a bullish market.
-
Aggressive F&O traders - Buy the February futures on declines at the 1020 - 1025 levels and maintain a stop loss at the 990 level. Expect to book profits at the 1070 - 1080 levels.
-
Fixed income strategy - n/a
-
Derivatives contract size - market lot = 300 shares, margins approx Rs 55,000 ( subject to change daily )
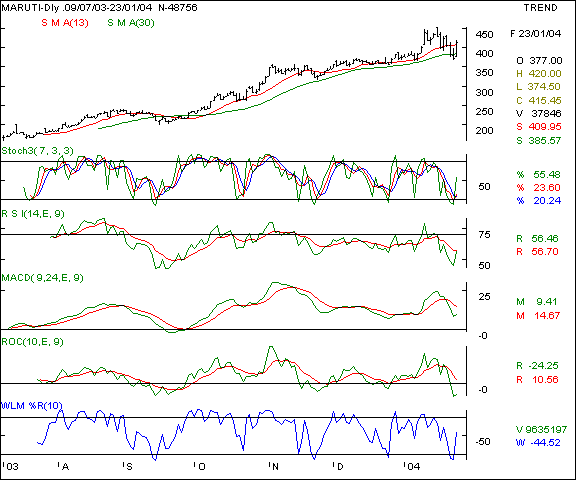
Maruti - we have been recommending a buy on this automobile powerhouse as the numbers expected from the company suggest that the counter is likely to see rapid upmoves based on fundamental and technical strength. Previous recommendations were made vide our editions dtd 18/10/03, 08/11/03, 03/01/04 ( click here to view our previous editions ). The 30 day SMA is proving to be a good support and the same is poised at the 385 levels. We recommend a buy on declines for the patient investor.
Your call of action -
-
Investors / cash segment players - we advocate delivery based buying into the counter at Rs 390 only with a stop loss at 374 and a target of 450 - 475 be maintained by end of February in a firm market.
-
Aggressive F&O traders - buy the February futures on slight declines of 405 and maintain a stop loss at the 393. Expect to book profits at the 425 / 430 in the short term.
-
Fixed income strategy - n/a
-
Derivatives contract size - market lot = 1600 shares, F&O margins = 2,60,000 ( margins subject to change daily )
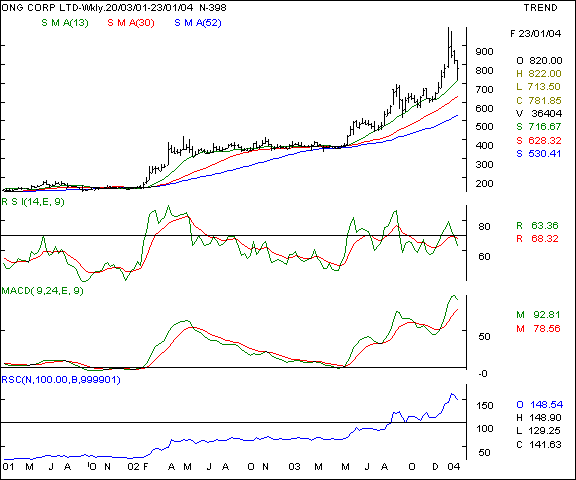
ONGC - This counter was identified by us since the price was 630 and has been recommended vide editions dtd 09/08/03, 15/08/03, 23/08/03, 06/09/03, 20/12/03 and 17/01/04. The scrip has yielded handsome rewards to bulls( click here to view our previous editions ). The profit taking in the pre-election scenario is an ideal time for patient investors to start nibbling into the counter. The retail thrust and international forays are a major boost for the company. The investor / trader / FII interest is expected to remain strong on this counter in year 2004. The price retracement theory suggests a support at the 790 levels which is a 50 % fall from the top in the rally that started from 585. We recommend a buy.
Your call of action -
-
Investors / cash segment players - we advocate fresh delivery based buying into the counter at 770 and room for averaging be kept till 730. Maintain a stop loss at 710 and a target of 1000 be maintained by the end of a quarter. Previous weeks buy should be held with same stop loss.
-
Aggressive F&O traders - Buy the February futures ( quoting at Rs 2 premium to cash ) on declines of 774 and hold with a stop loss at 758. Expect a price level of 820 in the near term.
-
Fixed income strategy - n/a
-
Derivatives contract size - Market lot = 600, F&O margins = 145000 ( subject to change daily )
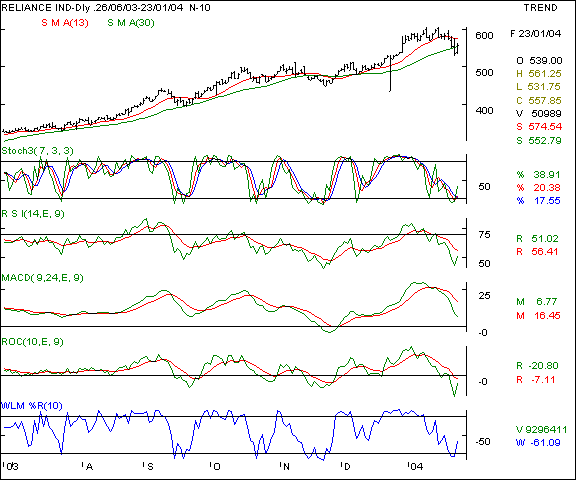
Reliance - this market leader has been advocated by us a scrip likely to lead the markets from the front. The scrip has not failed to live upto our expectations and is a market out-performer by a wide margin. Previously recommended vide our editions dtd 07/06/03, 14/06/03, 21/06/03, 05/07/03, 26/07/03, 02/08/03, 09/08/03, 23/08/03, 30/08/03, 06/09/03, 20/09/03, 27/09/03, 04/10/03, 11/10/03, 26/10/03, 01/11/03, 08/11/03, 20/12/03, 27/12/03, 03/01/04 & 18/01/04 ( click here to view our previous editions ). The stock has shown tremendous resilience as it has bucked the trend and maintained a relatively strong undertone inspite of profit taking in the overall markets. The oscillators show a bounce back from oversold levels and the pre-result trade should see speculative build up on the counter.
Your call of action -
-
Investors / cash segment players - we advocate fresh delivery based buying into the counter at Rs 555 only with a stop loss at 540 and a target of 610 be maintained in the medium term.
-
Aggressive F&O traders - Buy the February futures at 562 levels ( quoting at Rs 8 premium to cash ) and maintain a stop loss at the 554 levels. Expect a price of 584 to 588 in the short term - in a conducive market.
-
Fixed income strategy - n/a.
-
Derivatives contract size - Market lot = 600, F&O margins = Rs 80,000 ( subject to change daily )
|
Indices - domestic |
BSE Sensex - Last week, we predicted that this correction is the first meaningful one after November 2003 and the same is being proved by the wild gyrations in the market prices. The index has seen a near term bottom and is unlikely to see a similar fall - barring unforeseen circumstances. However, the near term upsides also seem limited to the 6000 - 6050 mark in the coming week.
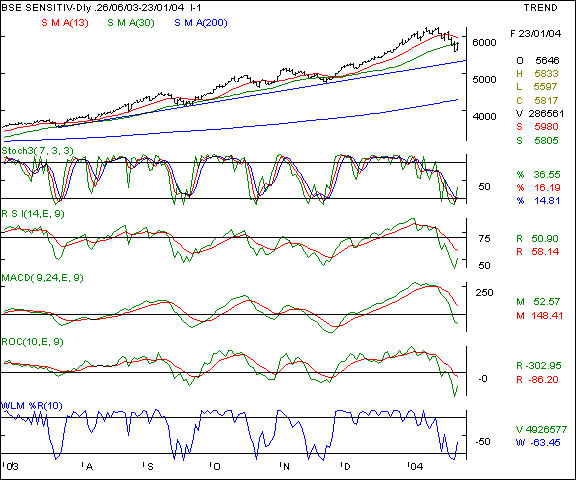
Your call of action - Since the Sensex futures are not very liquid, we suggest trading the Nifty 50 instead.
Nifty 50 - last week, we had advocated that the Nifty was expected to see high volatility with support at the 1820 levels and a close 1850 levels, all of which has been proved accurate ( click here to view our previous editions ). The fresh target for the index is at the 1915 levels in the week ahead. Further down, expect support at the 1750 levels in the week ahead. We expect high consolidation in the coming week ( just as we had last week too ) as stocks are expected to change hands from weaker to stronger hands. Only above a conclusive closing over 2025 levels, with higher volumes and a positive breadth, will the next target be achieved.
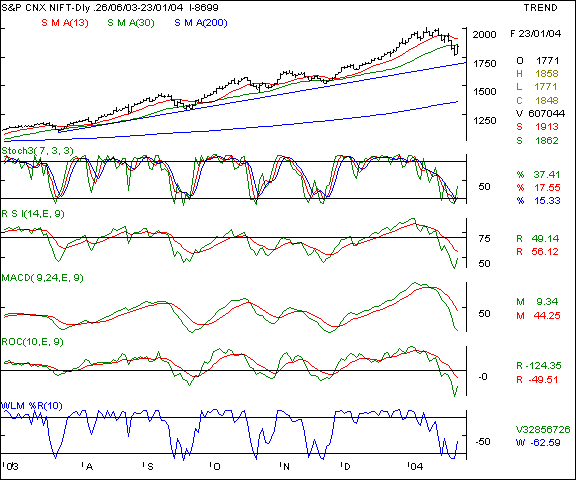
Your call of action - We advocate fresh trades on the Nifty on the long side only on declines that too in an indirect fashion by selling puts or buying calls to be on the safer side. Sell the February 1700 puts at a premium of Rs 20 or above.
|
Indices - international |
Dow Jones Industrial Average - This old economy benchmark index measures the outlook on the New York stock exchange. Last week we had advocated resistance at the 10,600 - 10,675 levels & support at the 10200 ( click here to view our previous editions ). The Dow Jones has under performed as compared to the Nasdaq and is likely to see resistance at the 10750 levels. Expect the 10,280 levels to be a good short term base for this index in the near term.
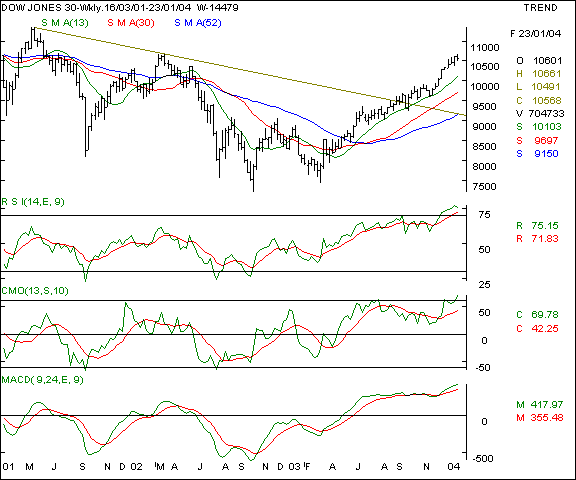
Your call of action - Since Indian investors are not allowed to trade in overseas markets, this is a pure academic study.
Nasdaq - This new economy benchmark index measures the outlook on the Nasdaq exchange. This index has made a new 30 month high ( highest since July ' 01) recently and has been advocated by us as making a saucer formation. The relative strength of this index is surpassing the Dow. Last week, we forecast that the 2180 levels will be a short term target ( click here to view our previous editions ). The 2000 levels remain a good base for this index and only above the 2170 levels, should you expect a fresh upmove.
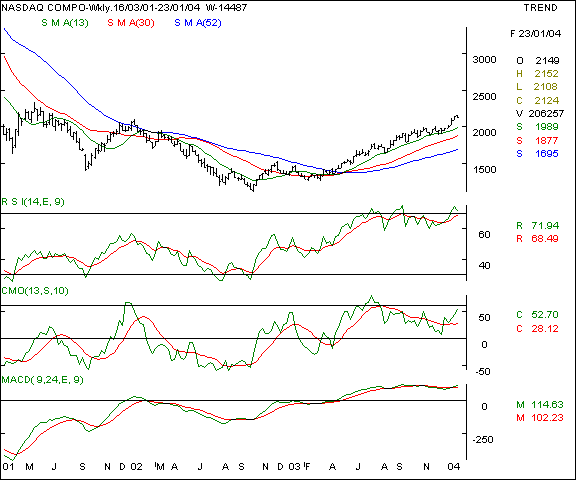
Your call of action - Since Indian investors are not allowed to trade in overseas markets, this is a pure academic study.
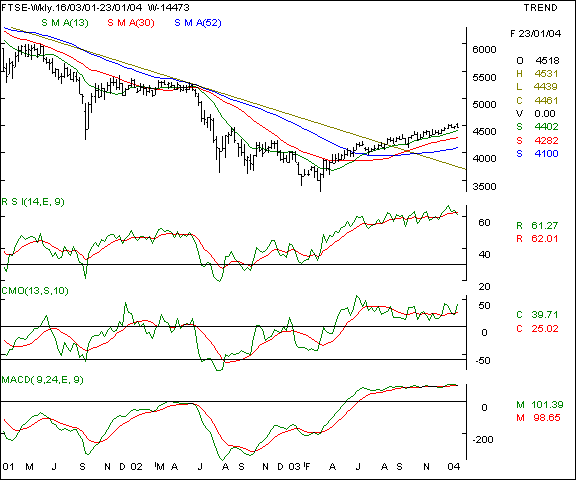
FTSE - This index measures the outlook on the London stock exchange. As we have been forecasting a 4300 level support, this index is making a base in the near term and showing short term strength ( click here to view our previous editions ). Our outlook though positive for this index is also that of an under-performer as compared to the US markets. The oscillators are pointing towards a consolidation at present levels - only above a conclusive close above 4560 levels, will a new rally start.
Your call of action - Since Indian investors are not allowed to trade in overseas markets, this is a pure academic study.
|
Trading tips for the week |
-
The put / call ratio is steady at the 0.22 : 1 levels and the outstanding positions in the derivatives segment have decreased significantly. The FII investments are slowing down and pre-election outlook is steady. The Nifty and Sensex being under pressure, expect sharper volatility.
-
There is offloading at higher levels in stock futures. That indicates a cautious approach as long positions in individual stocks is being hedged by Nifty shorts.
-
The index heavy-weights are showing bar reversals at new highs. This fact was also mentioned in the previous week. This is a worrying indicator in the near term.
-
The news of positive employment data will help the US $ and in turn the technology sector in the domestic markets. The Nasdaq is climbing faster than the Dow Jones average and that could see tech stocks ruling firm. That should boost the indices as tech stocks are heavily weighted in the indices.
-
Stocks that are due for results announcements are likely to see highly polarised trading volumes in the near term.
-
Trades must be executed in small volumes due to the higher volatility expected. Trade fewer counters and conserve cash for future opportunities.
-
Standby for fresh recommendations via SMS on a real - time basis.
- Have a profitable week.
- Vijay L Bhambwani
- Ceo :- Bsplindia.com
The author is a Mumbai based investment consultant and invites feedback at Vijay@BSPLindia.com and ( 022 ) 23438482 / 23400345.
SEBI disclosure :- The author has no positions in any securities mentioned above.
- While all due care has been taken while in compiling the data enclosed herein, we cannot be held responsible for errors, if any, creeping in. Please consult an independent qualified investment advisor before taking investment decisions. This mail is not sent unsolicited, and only advisory in nature. We have accepted no consideration from any company mentioned above and recommend taking decisions on merits of the stocks from our viewpoint. This email is being sent to you as a paid subscriber. Please protect your interests and ours by not disclosing the contents to any un-authorised person/s
Legal notice :- The Professional Ticker Reader is a trademark of Bhambwani Securities (P) Ltd. and any un-authorised replication / duplication in part or full will be infringing our trademark and will result in legal action being enforced on the infringing persons / parties.