- The Professional Ticker Reader TM
- Your accurate, authentic and affordable guide to investing
Flavours of the week March 21, 2004
These are stocks that we expect to out-perform the markets. Cash and derivative strategies are advised thereon. Please stay online to enable loading of graphics from our servers. Please also read the trading tips section at the end of the newsletter.
|
Individual stocks. |
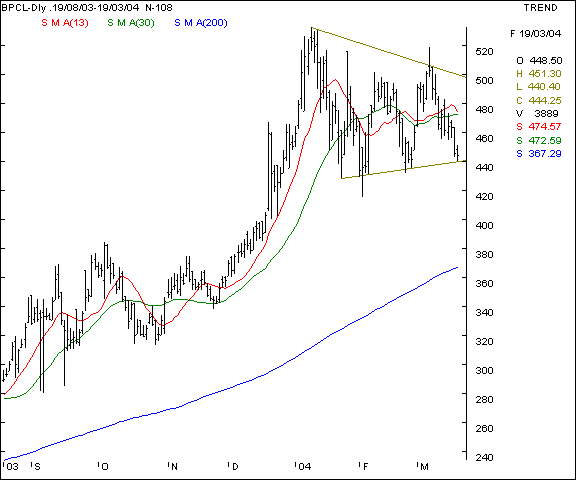
BPCL - The stock is showing a weak trend as the chart below shows. The wedge made in the graph shows a support at the 440 levels which if violated, will make the scrip quite weak and take the stock to the 428 - 430 supports. It maybe noted that these levels are a last mile support for the scrip, below which a free fall can occur. We recommend a short sell on declines for the higher risk trader.
Your call of action -
-
Investors / cash segment players - do not stay long on the counter if the scrip breaks the 430 levels with higher volumes.
-
Aggressive F&O traders - Short sell the April futures below the 442 mark with a stop loss at the 447 levels and an immediate target of 433 / 434 levels.
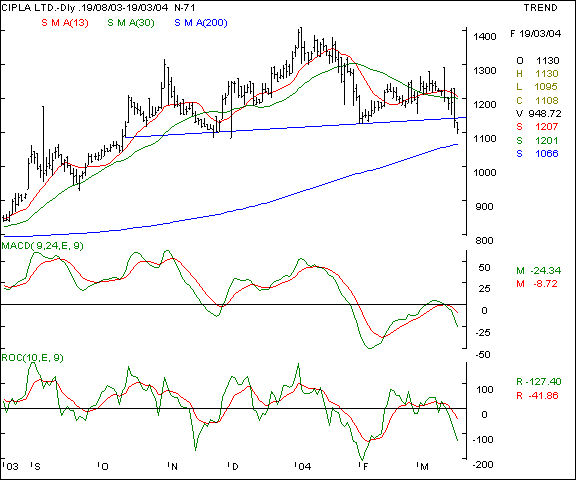
Cipla - This scrip is trading below it's support trendline which also happens to be the neckline of a head and shoulder formation. The formation forecasts a bearish trend for the counter in the near term and the outlook is supported by the oscillators which are pointing to a fall also. The absolute short term support would be at the 200 day SMA which is at the 1070 levels currently. We advocate watching the traded volumes for a confirmation of the bearishness. Falls must occur with high volumes before a short sell decision is taken.
Your call of action -
-
Investors / cash segment players - delivery based holdings maybe liquidated as long as the scrip stays below the 1135 mark. Re-enter at significantly lower levels.
-
Aggressive F&O traders - Short sell the April futures at current levels ( 1118 ) with a stop loss at the 1150 levels and a downward target of 1070 - 1080 levels.
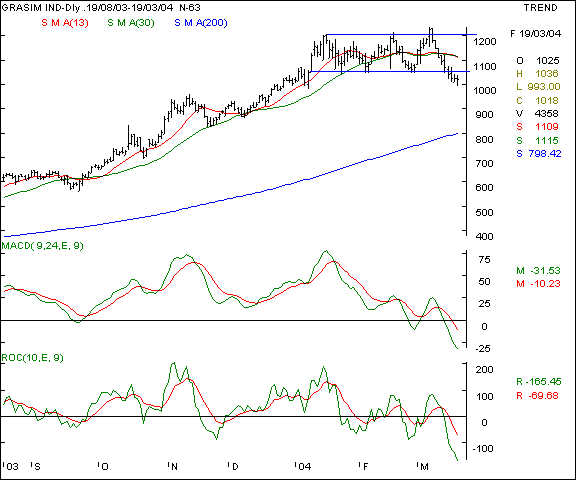
Grasim - this scrip has had a tremendous run upwards and is now reacting along with the entire market. The scrip has violated the sideways channel and has fallen with relatively high volumes which makes the outlook as weak in the near term. The momentum oscillators are pointing towards a fall in the near term and we advocate a sell on significant advances.
Your call of action -
-
Investors / cash segment players - delivery based investors may start selling the scrip on advances of 1040 or higher. The outlook is weak if the stock remains below the 1030 levels and re-entry maybe contemplated at lower levels.
-
Aggressive F&O traders - Short the April futures at 1045 levels, keeping a stop loss at the 1065 levels. Expect to book profits at the 990 levels in a conducive market.
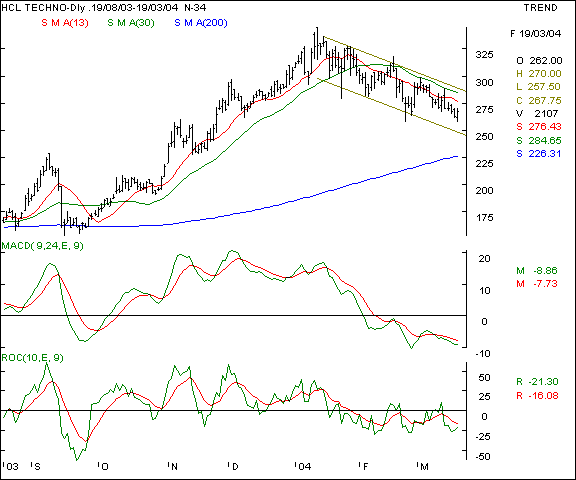
HCL Tech - This computer software major is moving in a downward sloping channel and is making lower tops and bottoms formation. The outlook for the scrip is weak and we advocate a sell on major advances. There maybe a temporary strength in the technology sector in the run up to the earnings season but the outlook remains weak.
Your call of action -
-
Investors / cash segment players - start liquidating your holdings on advances above the 275 - 280 mark. Expect to re-enter at significantly lower levels.
-
Aggressive F&O traders - Short sell the April futures at the 276 and above levels, keeping a stop loss at the 286 levels and a profit taking level of 255 - 260 after the results are announced.
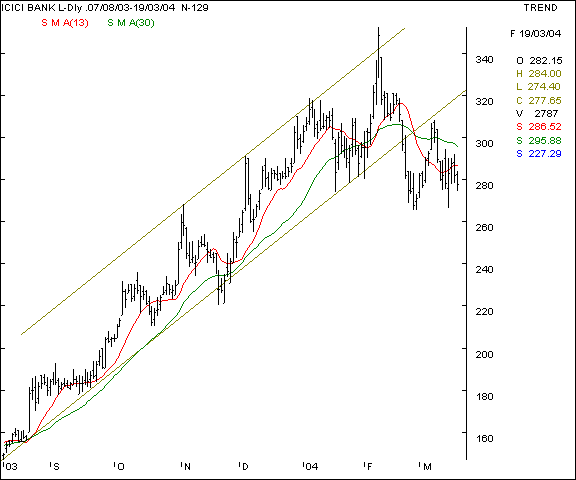
ICICI Bank - This banking major has been advocated by us a good investment on declines and is currently reaching entry levels. What is noteworthy is the fact that the scrip has made a head & shoulder formation with the neckline being at the 300 mark. Since the peak of the head was at the 350 mark, we expect the fall to be of an equivalent magnitude ( Rs 350 - 300 = Rs 50 ) from the neckline. A target price of 250 is arrived at, which is a text book style completion of the formation. However, the markets maynot exactly behave in textbook format and buying maybe contemplated at slightly higher levels.
Your call of action -
-
Investors / cash segment players - Delivery based buyers can start buying the stock at levels of 255 - 260 with a liberal stop loss of 248 and expect to book profits at the 280 levels.
-
Aggressive F&O traders - Start buying the April futures on declines, preferably at the 265 levels and maintain a liberal Rs 10 stop loss. Expect to take profits at the 277 - 280 mark by the month end.
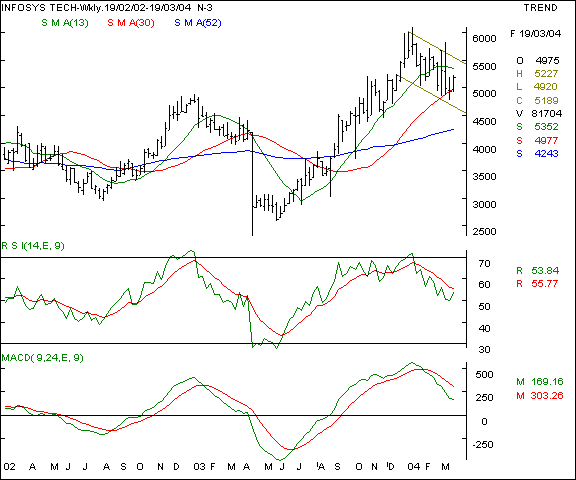
Infosys - this software bell weather is moving in a downward sloping channel and the sentiments for the sector are likely to be weak as long as the US elections are not over, the BPO issues clarified and the US economy itself shows a sustainable upmove. We recommend a short sell on all major advances and feel that the current upmove is a regular pre-result build up.
Your call of action -
-
Investors / cash segment players - delivery based investors may start selling the scrip above the 5350 mark and expect to cash out by 5500 levels - if the scrip goes that high.
-
Aggressive F&O traders - Start selling the April futures short on advances of 5350 and maintain a Rs 100 stop loss. We expect the post result price of 5150 - 5200 where profits maybe booked. Options players may sell the April 5500 calls at a premium of Rs 150.
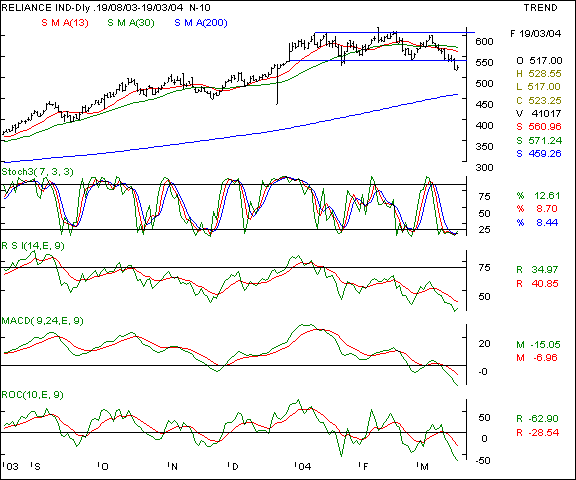
Reliance Inds - this stock is another example of a head & shoulder formation and the fall below the neckline is a confirmation of the same. The oscillators are pointing towards a weakness in the counter and barring the possibility of a pullback to the neckline ( which is a typical head and shoulder attribute ), we do not see fresh triggers for the counter. If the counter stays below the 540 mark, expect sub - 500 levels to be a reality.
Your call of action -
-
Investors / cash segment players - start selling holdings near the 540 mark in a staggered manner and hope to exhaust the same by 560 - if at all that level is achieved.
-
Aggressive F&O traders - Sell the April futures short on major advances at 535 ( quoting at Rs 5 premium to cash ) levels, keeping a stop loss at the 548 levels. Expect profit taking at the 515 levels. If the markets are weaker, expect below 500 levels in the medium term.
|
Indices - domestic |
BSE Sensex - The Sensex is now entrenched in a bearish channel and making lower tops and bottoms formation. The short term momentum oscillators are pointing towards a possibility of a bounce-back of 2 - 3 % at which point, the Index is a short sell for the aggressive traders.
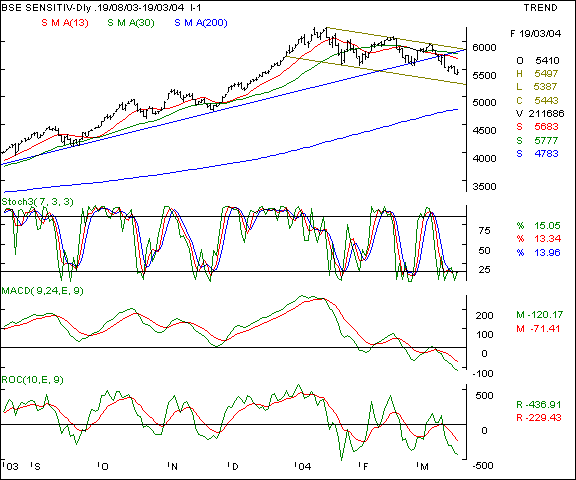
Your call of action - Since the Sensex futures are not very liquid, we suggest trading the Nifty 50 instead.
Nifty 50 - The index is moving in a downward sloping channel and is making lower tops and bottoms formations. The pattern is similar to the BSE Sensex and the possibility of a bounceback is fair as long as the 1700 levels are not violated. However, traders must remember that the upsides are likely to see heavier selling by nervous bulls who are likely to surrender long positions. The upmoves are therefore likely to terminate without a warning. We recommend a sell on all major advances.
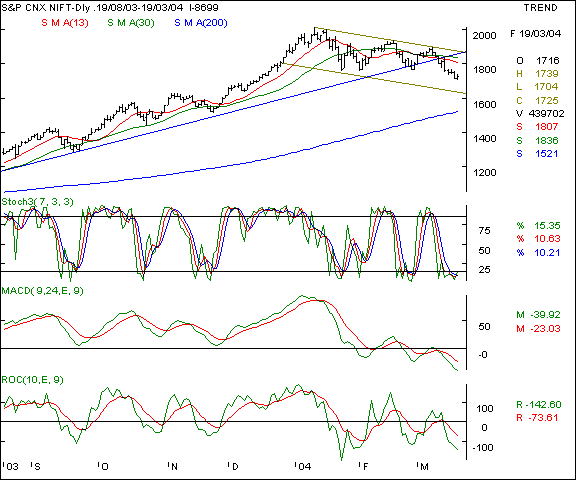
Your call of action - We advocate fresh trades on the Nifty on the short side only and that too above the 1765 - 1770 levels - should the index reach that level. We advocate short selling in small lots and keeping a liberal stop-loss at the 1790 levels. We expect the next fall to take the Nifty well below the 1700 mark. Fixed income traders can refer to the derivatives newsletter for selling the April calls and get good returns on investment.
|
Indices - international |
Dow Jones Industrial Average - This old economy benchmark index measures the outlook on the New York stock exchange. Last week we had advocated support at the 10,000 levels ( click here to view our previous editions ) which proved a major psychological support for the markets. The Dow Jones has retraced from the 10750 mark and is showing signs of profit taking on advances. The index is likely to remain under pressure till it surpasses the 10750 levels with heavy volumes. Expect the 10,000 levels to be a good short term base for this index in the near term.
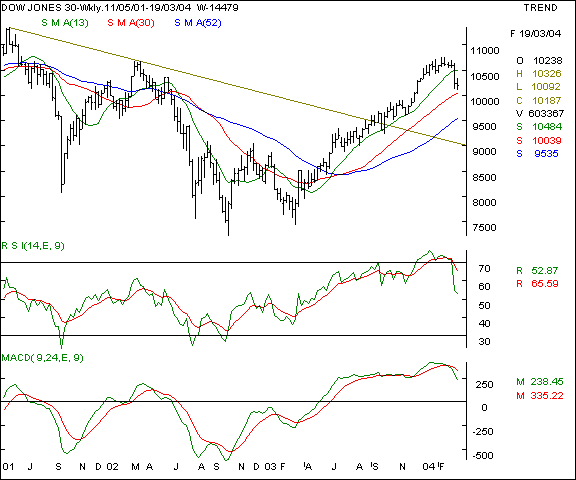
Your call of action - Since Indian investors are not allowed to trade in overseas markets, this is a pure academic study.
Nasdaq - This new economy benchmark index measures the outlook on the Nasdaq exchange. This index is making lower tops and bottoms and is showing significant weakness, thereby making the chances of a major recovery as dim. The 1868 levels would remain a good base for this index - which if violated, will take the Nasdaq to 1810 levels. Only above a 2175 close, expect the next resistance at the 2240 - 2250 levels. Till then, the outlook remains weak.
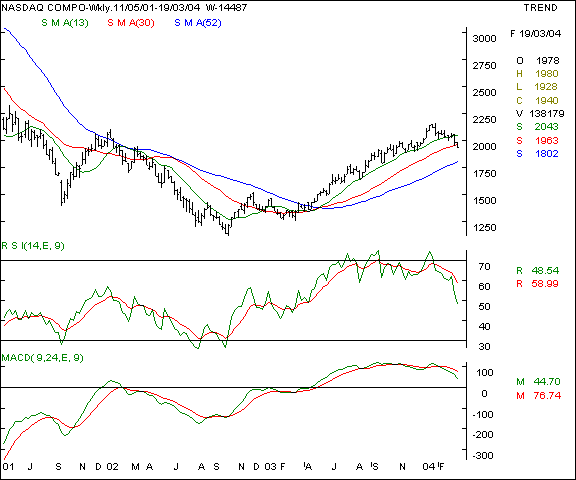
Your call of action - Since Indian investors are not allowed to trade in overseas markets, this is a pure academic study.
FTSE - This index measures the outlook on the London stock exchange. As we have been forecasting a 4300 level support, this index is making a base in the near term and showing short term weakness ( click here to view our previous editions ). Our outlook though mildly negative for this index is now that of an out-performer as compared to the US markets. The oscillators are pointing towards a fall at present levels - only above a conclusive close above 4560 levels, will a new rally start.
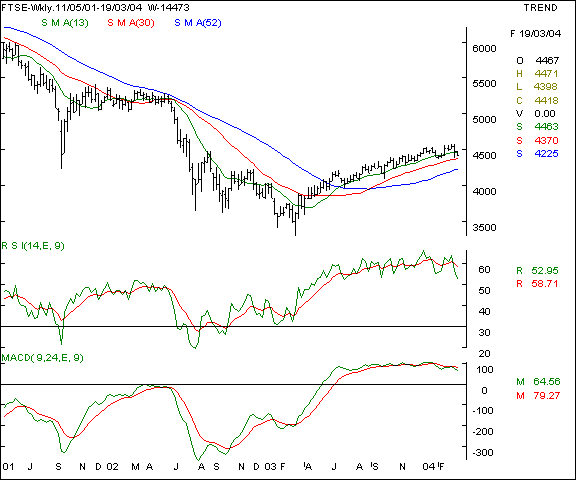
Your call of action - Since Indian investors are not allowed to trade in overseas markets, this is a pure academic study.
|
Trading tips for the week |
-
The put / call ratio is climbing and is currently at the 0.30 : 1 levels and the outstanding positions in the derivatives segment have shown a qualitative deteteoration. The FII investments are continuing steadily.
-
There is offloading at higher levels in stock futures. That indicates a cautious approach as long positions in individual stocks is being hedged by Nifty shorts.
-
The current week is crucial for the markets as March series are due for expiry and it is also the year end for the mutual fund industry.
-
The index heavy-weights are showing weakness again. This in turn will drag the indices and cause nervousness.
-
Trades must be executed in small volumes due to the higher volatility expected. Trade fewer counters and conserve cash for future opportunities.
-
Standby for fresh recommendations via SMS on a real - time basis.
- Have a profitable week.
- Vijay L Bhambwani
- Ceo :- Bsplindia.com
The author is a Mumbai based investment consultant and invites feedback at Vijay@BSPLindia.com and ( 022 ) 23438482 / 23400345.
SEBI disclosure :- The author has no positions in any securities mentioned above.
- While all due care has been taken while in compiling the data enclosed herein, we cannot be held responsible for errors, if any, creeping in. Please consult an independent qualified investment advisor before taking investment decisions. This mail is not sent unsolicited, and only advisory in nature. We have accepted no consideration from any company mentioned above and recommend taking decisions on merits of the stocks from our viewpoint. This email is being sent to you as a paid subscriber. Please protect your interests and ours by not disclosing the contents to any un-authorised person/s
Legal notice :- The Professional Ticker Reader is a trademark of Bhambwani Securities (P) Ltd. and any un-authorised replication / duplication in part or full will be infringing our trademark and will result in legal action being enforced on the infringing persons / parties.