Global market indices - weekly feature - Feb 15, 2004
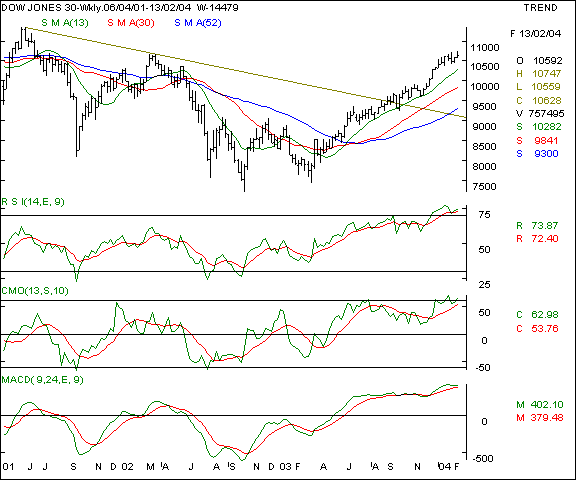
Click here to view other previous reports >> Dow Jones Industrial Average - This old economy benchmark index measures the outlook on the New York stock exchange. Last week we had advocated resistance at the 10,750 levels ( click here to view our previous editions ) which proved a major hurdle for the markets. The Dow Jones has retraced from the 10747 mark !!! The index is likely to remain under pressure till it surpasses the 10750 levels with heavy volumes. Expect the 10,500 levels to be a good short term base for this index in the near term.
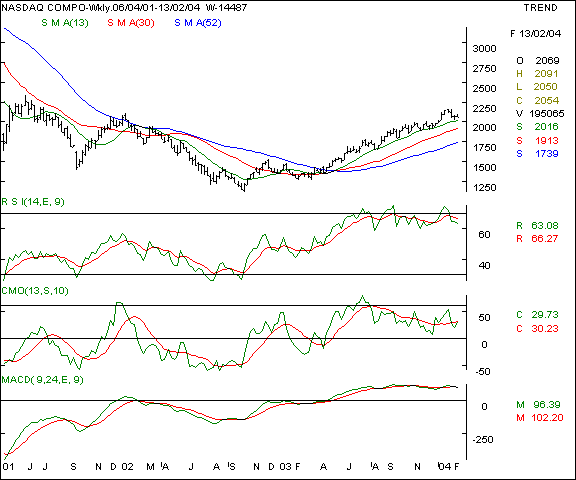
Your call of action - Since Indian investors are not allowed to trade in overseas markets, this is a pure academic study. Nasdaq - This new economy benchmark index measures the outlook on the Nasdaq exchange. This index has made a new 30 month high ( highest since July ' 01) recently and has been advocated by us as making a saucer formation. The relative strength of this index is surpassing the Dow. Last week, we forecast that the 2000 levels will be a short term support and the index took support at the 2050 mark ( click here to view our previous editions ). The 2000 levels would remain a good base for this index. This level has been proved accurate, and only above a 2175 close, expect the next resistance at the 2240 - 2250 levels.
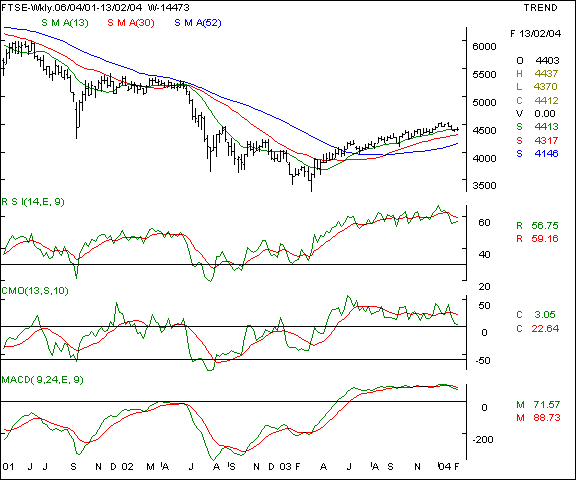
Your call of action - Since Indian investors are not allowed to trade in overseas markets, this is a pure academic study. FTSE - This index measures the outlook on the London stock exchange. As we have been forecasting a 4300 level support, this index is making a base in the near term and showing short term weakness ( click here to view our previous editions ). Our outlook though mildly positive for this index is also that of an under-performer as compared to the US markets. The oscillators are pointing towards a fall at present levels - only above a conclusive close above 4560 levels, will a new rally start.
Your call of action - Since Indian investors are not allowed to trade in overseas markets, this is a pure academic study. |
Your feedback is important ! Please click here to let us know your views. Click here to inform a friend about this page on our website.


