Global market indices - weekly feature - June 07, 2004
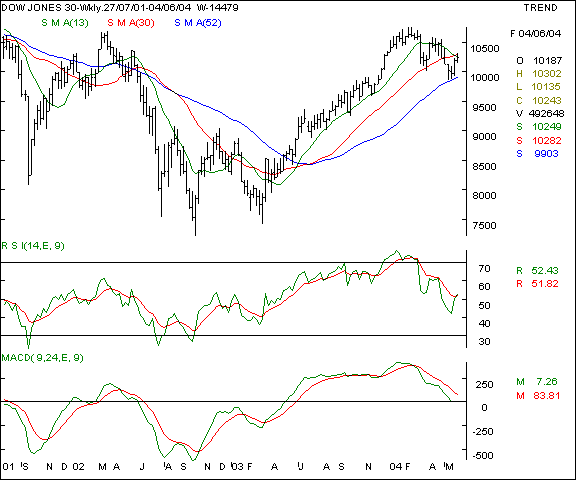
Dow Jones Industrial Average - this old economy benchmark is showing signs of revival after having taken support at the 52 week average. Should the index stay above the 10,300 mark, expect the bullishness to continue and the Dow Jones to test the 10460 levels. On the lower side, expect profit taking to take the index down to the 10100 mark in the coming week.
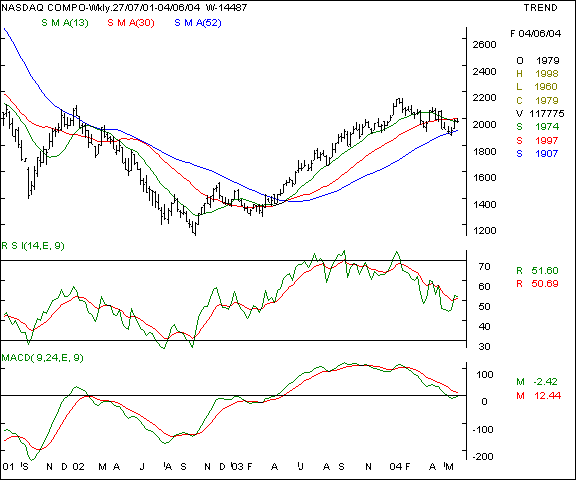
Your call of action - Since Indian investors are not allowed to trade in overseas markets, this is a pure academic study. Nasdaq - this new economy index is showing relative under performance as compared to the Dow Jones and faces tremendous congestion at the 2000 levels, which needs to be surpassed on a continous closing basis. Should the upmove be possible, expect resistance at the 2080 and lower support at the 1910 levels.
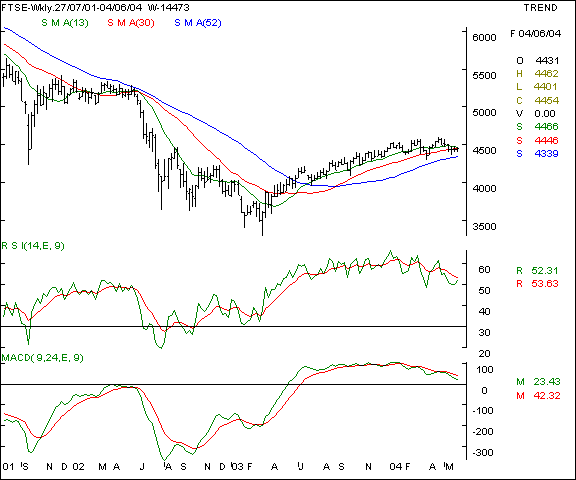
Your call of action - Since Indian investors are not allowed to trade in overseas markets, this is a pure academic study. FTSE - This UK benchmark index is showing a flat movement in a narrow sideways movement between the 4325 and the 4500 levels. Unless there is a breakout / breakdown beyond these levels, expect the scrip to remain sideways in the near term.
Your call of action - Since Indian investors are not allowed to trade in overseas markets, this is a pure academic study.. |
Your feedback is important ! Please click here to let us know your views. Click here to inform a friend about this page on our website.


