- Your accurate, authentic and affordable guide to investing
Flavours of the week Jan 16, 2005
These are stocks that we expect to out-perform the markets. Cash and derivative strategies are advised thereon. Please stay online to enable loading of graphics from our servers. Please also read the trading tips section at the end of the newsletter.
|
Individual stocks. |
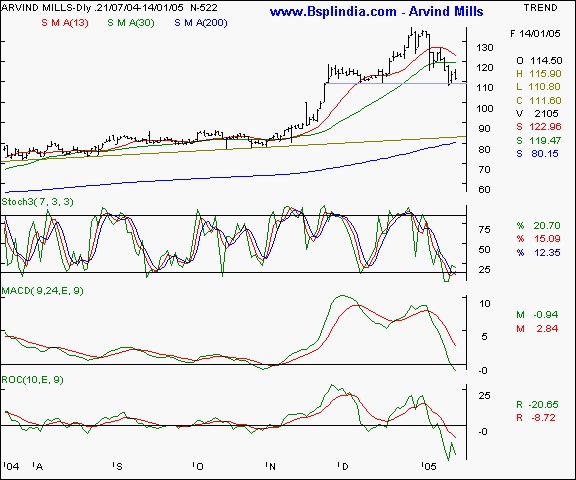
Arvind Mills - this textile major was recommended vide our earlier editions Dtd. Sept 09, Oct 10 and Oct 31, 2004. Please click here to view previous reports. The scrip is making lower tops and bottoms formation and is currently trading near a critical trendline support at 109.50 levels. The scrip is trading below it's short & medium term averages and the averages themselves are pointing lower. That shows selling pressure at higher levels. Traders have made good profits in the last week on two days by going short on the counter. We recommend a negative bias on the scrip especially if two criteria are fulfilled - the markets turn weak again and the scrip starts trading below the 109 levels convincingly. This being a short term recommendation, we advocate small lots and that too for higher risk, short sales savvy traders only.
Your call of action -
-
Investors / cash segment players - n/a.
-
Aggressive F&O traders - Sell the February futures short once the markets turn weak and the scrip trades convincingly below the 110 mark in futures. Maintain a stop loss at the 111.50 and a target of 106 / 107 in the short term in a weak market. If the breakdown does not occur, we advise short sales at the 117.50 - 118.50 band with a stop loss at the 120 levels. Profit taking is likely at the 114.50 levels.
-
Derivatives contract size - Market lot = 4,300 shares. F&O margin = approx Rs 1,15,000 (subject to change daily )
Arvind Mills I BPCL I Glaxo I HDFC Bank I Hind lever I HPCL I IPCL I Ranbaxy I Raymond I Telco I Tisco I Tata Power I BSE Sensex I Nifty I CNX-IT I Dow Jones I Nasdaq I FTSE I Top I Close window I Print page
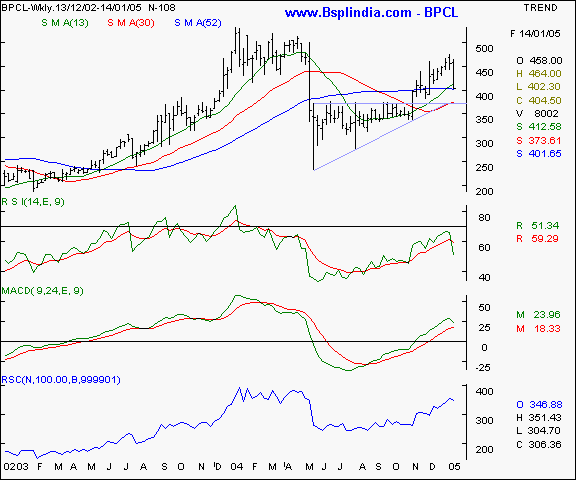
BPCL - this scrip was recommended vide our earlier editions Dtd. Dec 26, 2004 and Jan 01, 2005. Please click here to view previous reports. The scrip is news driven as the international prices of crude oil largely influence this refining majors short term directions. Technical traders will note two important aspects about this chart - the scrip has seen a 15 % fall last week & the fall has occurred from below the May 17, 2004 highs. That shows the inherent weakness on the counter in the absolute near term. Also note the ascending triangle formation on the chart and the scrip on the threshold of the 52 week SMA at the 400 levels. We feel this level is a crucial support, if violated will result in further weakness. The near term support is likely at the triangle top which coincides with the 30 week SMA at the 375 levels. High risk traders may go short on the counter upon a confirmed breakdown from the 400 levels in a bearish market.
Your call of action -
-
Investors / cash segment players - n/a.
-
Aggressive F&O traders - short sell the Jan futures ( Feb futures are not liquid yet ) once the price falls below the 402 levels. Maintain a stop loss at the 410 - 412 levels and expect to book profits at the 485 - 488 levels in a conducively weak market ( especially with rising crude prices ) in the short term.
-
Derivatives contract size - Market lot = 550 shares. F&O margin = approx Rs 39,000 (subject to change daily )
Arvind Mills I BPCL I Glaxo I HDFC Bank I Hind lever I HPCL I IPCL I Ranbaxy I Raymond I Telco I Tisco I Tata Power I BSE Sensex I Nifty I CNX-IT I Dow Jones I Nasdaq I FTSE I Top I Close window I Print page
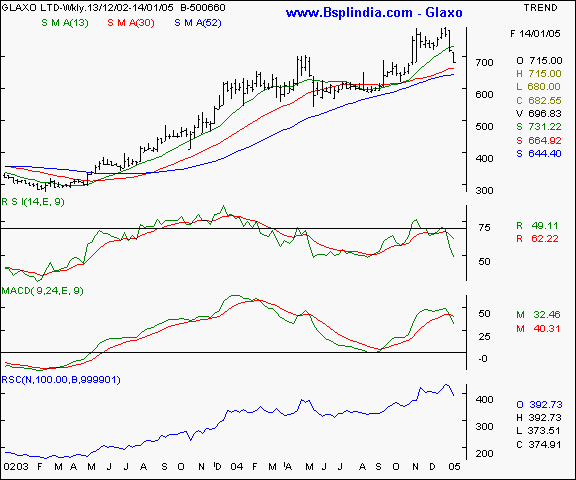
Glaxo - this scrip was recommended vide our earlier editions Dtd. Sept 19, Oct 03, Oct 10, Nov 07, Nov 21, Dec 12 and Dec 19, 2004. Please click here to view previous reports. We feel the MNC pharma stocks have taken a beating in excess of the market logistics and are overdone on the downsides. For a discerning investor, lower levels offer attractive short / medium term investment opportunities for pure delivery based investors. We recommend a buy on significant declines near the 52 week SMA supports.
Your call of action -
-
Investors / cash segment players - Buy on declines in small lots at the 650 - 660 levels and hold with a liberal stop loss at the 625 levels. Expect to book profits in a firm market in a few months at the 700 + levels.
-
Aggressive F&O traders - F&O n/a.
-
Derivatives contract size - F&O n/a.
Arvind Mills I BPCL I Glaxo I HDFC Bank I Hind lever I HPCL I IPCL I Ranbaxy I Raymond I Telco I Tisco I Tata Power I BSE Sensex I Nifty I CNX-IT I Dow Jones I Nasdaq I FTSE I Top I Close window I Print page
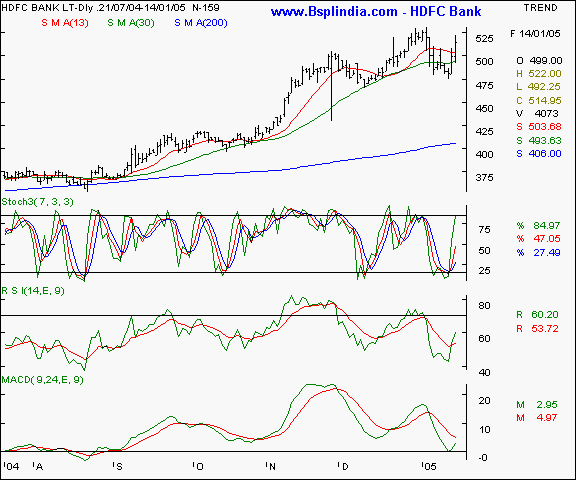
HDFC Bank - this banking scrip was recommended vide our earlier editions Dtd. Sept 19, Oct 03, Nov 07, Dec 12, Dec 26, 2004 and Jan 09, 2005. Please click here to view previous reports. The most noteworthy aspect of this scrip is the extremely high relative strength on this counter - whether in comparison to the Nifty - 50 or the BSE - 30. The scrip has exhibited consistently higher tops and bottoms formation and suggestive of strength in the undertone. We recommend a buy on declines as the previously advocated target of 540 holds good in the medium term.
Your call of action - .
-
Investors / cash segment players - Hold existing long positions as specified earlier. Buy on declines to the 505 levels in small lots and leave room for averaging till the 485 levels. Hold with a stop loss at the 472 levels in case the markets get excessively volatile. Expect profit taking at the 540 + levels in a conducive market in the short / medium term in a conducive market.
-
Aggressive F&O traders - Hold existing long positions and add February futures on declines at the 505 / 507 levels. Hold with a stop loss at the 494 levels and expect profit taking at the 525 / 530 levels in a conducive market in the short / medium term.
-
Derivatives contract size - Market lot = 800 shares. F&O margin = approx Rs 63,000 (subject to change daily )
Arvind Mills I BPCL I Glaxo I HDFC Bank I Hind lever I HPCL I IPCL I Ranbaxy I Raymond I Telco I Tisco I Tata Power I BSE Sensex I Nifty I CNX-IT I Dow Jones I Nasdaq I FTSE I Top I Close window I Print page
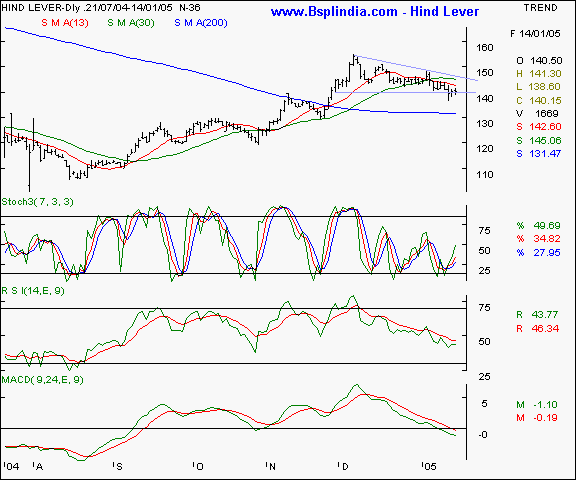
Hind Lever - This FMCG major is a index heavy-weight and is capable of swaying the indices with itself. Chartically speaking, the scrip has broken down below it's bearish triangle and also it's short / medium term averages. The oscillators are in a sell mode and we recommend a sell for the highly aggressive traders.
Your call of action -
-
Investors / cash segment players - n/a.
-
Aggressive F&O traders - short sell the Jan futures in minimal lots once it trades consistently below the 139 levels with higher volumes. Maintain a stop loss at the 144.50 levels and expect to book profits at the 132 / 133.50 levels in a falling market in the short / medium term. Trades must be initiated in small lots only.
-
Derivatives contract size - Market lot = 2,000 shares. F&O margin = approx Rs 47,000 (subject to change daily )
Arvind Mills I BPCL I Glaxo I HDFC Bank I Hind lever I HPCL I IPCL I Ranbaxy I Raymond I Telco I Tisco I Tata Power I BSE Sensex I Nifty I CNX-IT I Dow Jones I Nasdaq I FTSE I Top I Close window I Print page
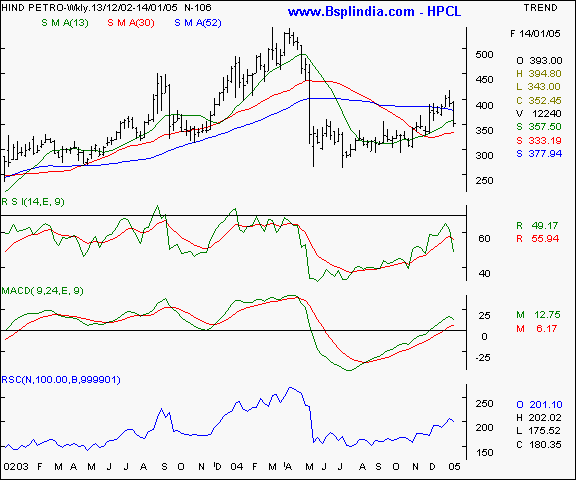
HPCL - this scrip was recommended vide our earlier editions Dtd. Sept 19, 2004 and Jan 02, 2005. Please click here to view previous reports. The story is similar to BPCL mentioned above and a savvy trader will need to watch the international crude prices for short term trend determination for this scrip. We foresee a 2 - 3 % fall in the scrip in case crude prices rise. A short sale is recommended on advances.
Your call of action - .
-
Investors / cash segment players - n/a.
-
Aggressive F&O traders - short the scrip in the February series near the 365 - 368 levels and hold with a stop loss at the 375 levels. Expect to book profits at the 352 - 355 levels in a weakening market in the short term. Limited exposure is advocated on this trade.
-
Derivatives contract size - Market lot = 650 shares. F&O margin = approx Rs 42,000 (subject to change daily )
Arvind Mills I BPCL I Glaxo I HDFC Bank I Hind lever I HPCL I IPCL I Ranbaxy I Raymond I Telco I Tisco I Tata Power I BSE Sensex I Nifty I CNX-IT I Dow Jones I Nasdaq I FTSE I Top I Close window I Print page
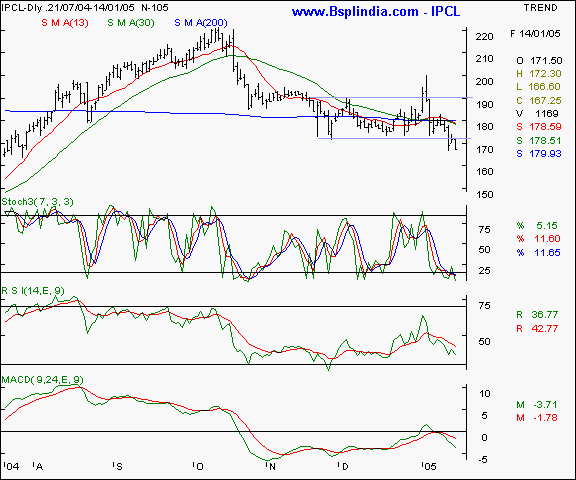
IPCL - this scrip was recommended vide our earlier editions Dtd. Oct 03, Oct 10 and Nov 21, 2004. Please click here to view previous reports. The important aspect to notice is the breakdown from a 6 week neutral channel and the weakness in the short & medium term moving averages which are turning lower. We recommend a short sell on advances in small lots for the high risk traders.
Your call of action -
-
Investors / cash segment players - n/a.
-
Aggressive F&O traders - Sell the February futures on rallies to the 176 - 178 levels and hold with a stop loss at the 184 levels. Expect to book profits at the 160 - 162 levels in the short / medium term in a conducive market.
-
Derivatives contract size - Market lot = 1,100 shares. F&O margin = approx Rs 32,000 (subject to change daily )
Arvind Mills I BPCL I Glaxo I HDFC Bank I Hind lever I HPCL I IPCL I Ranbaxy I Raymond I Telco I Tisco I Tata Power I BSE Sensex I Nifty I CNX-IT I Dow Jones I Nasdaq I FTSE I Top I Close window I Print page
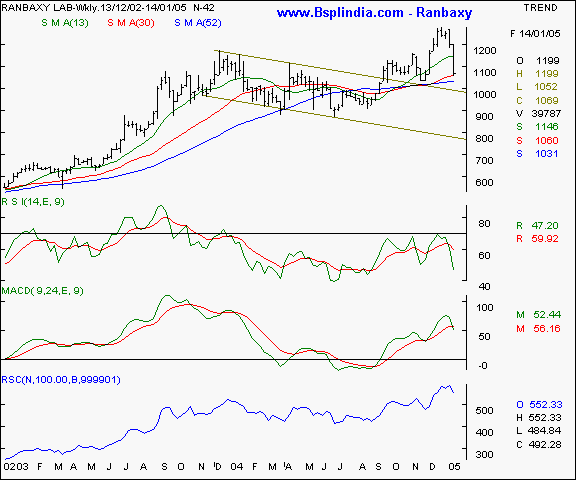
Ranbaxy - this scrip was recommended vide our earlier editions Dtd. Sept 19, Sept 26, Nov 07 and Nov 14, 2004. Please click here to view previous reports. The sharp fall on this scrip in the last fortnight has seen a 15 % drop in prices. A scrip with a relative strength of 550 + is investment worthy after a fall so steep. The technical support is significant near the 52 week SMA, which stood at the 1030 levels on Friday. We recommend a buy in small lots at these levels for the patient and disciplined investor - trader.
Your call of action - .
-
Investors / cash segment players - Buy the scrip at lower levels of 1025 and keep room for averaging down to the 975 levels. Maintain a stop loss at the 925 mark and expect to book profits at the 1080 - 1110 levels in the short / medium term.
-
Aggressive F&O traders - Buy the February futures in a declining market at the 1035 - 1040 levels and maintain a stop loss at the 1000 mark. Expect to book profits at the 1100 - 1125 levels in the medium term in a conducive market.
-
Derivatives contract size - Market lot = 400 shares. F&O margin = approx Rs 72,000 (subject to change daily )
Arvind Mills I BPCL I Glaxo I HDFC Bank I Hind lever I HPCL I IPCL I Ranbaxy I Raymond I Telco I Tisco I Tata Power I BSE Sensex I Nifty I CNX-IT I Dow Jones I Nasdaq I FTSE I Top I Close window I Print page
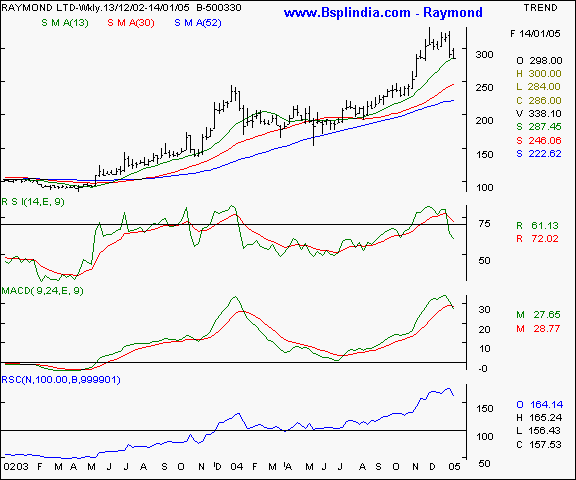
Raymond - this scrip was recommended vide our earlier editions Dtd. Sept 19, Nov 21 and Nov 27, 2004. Please click here to view previous reports. The scrip has been a strong market out-performer and is retracing lower as the market sentiments have weakened. Profit taking is likely to see a downward exertion of prices - possibly to the 250 levels, where the scrip is a buy.
Your call of action - .
-
Investors / cash segment players - Buying is recommended for the patient investor with a 6 month time frame or longer, at the 250 - 255 levels and a stop loss is advocated at the 220 mark. Expect to book profits at the 300 + levels in 6 months in a conducive market and at higher levels in 12 months duration.
-
Aggressive F&O traders - F&O n/a.
-
Derivatives contract size - F&O n/a.
Arvind Mills I BPCL I Glaxo I HDFC Bank I Hind lever I HPCL I IPCL I Ranbaxy I Raymond I Telco I Tisco I Tata Power I BSE Sensex I Nifty I CNX-IT I Dow Jones I Nasdaq I FTSE I Top I Close window I Print page
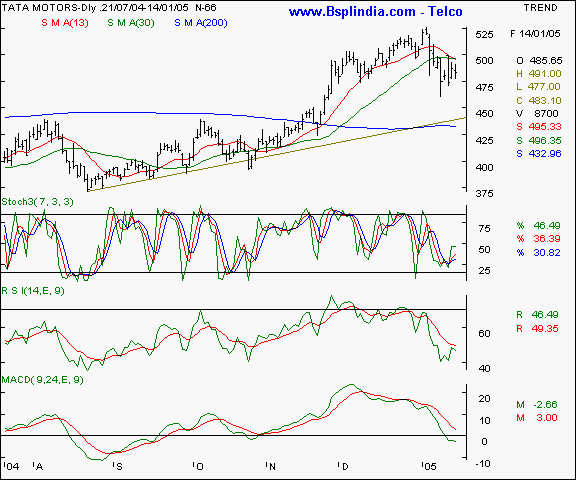
Telco - was recommended vide our earlier editions Dtd. Oct 02, Oct 23 and Nov 14, 2004. Please click here to view previous reports. The scrip is reacting lower on profit taking and has a triple bottom short term support at the 475 levels. Should it close below the 475 mark, expect a steeper fall to the 465 - 468 levels. The oscillators are in a sell mode and the the moving averages are showing weakness / selling bias on advances. Aggressive traders may short the counter.
Your call of action -
-
Investors / cash segment players - n/a.
-
Aggressive F&O traders - Short the February futures once the spot price falls below the 475 mark and that too on higher volumes. In a weak market, a price target of 465 - 468 be expected. Maintain a stop loss at the 482 levels.
-
Derivatives contract size - Market lot = 825 shares. F&O margin = approx Rs 68,000 (subject to change daily )
Arvind Mills I BPCL I Glaxo I HDFC Bank I Hind lever I HPCL I IPCL I Ranbaxy I Raymond I Telco I Tisco I Tata Power I BSE Sensex I Nifty I CNX-IT I Dow Jones I Nasdaq I FTSE I Top I Close window I Print page
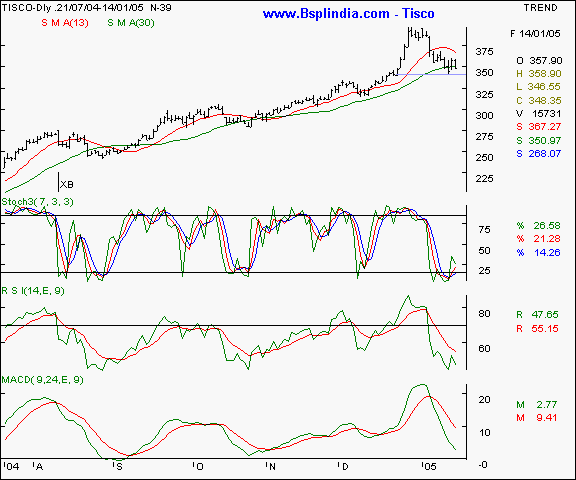
Tisco - this scrip was recommended vide our earlier editions Dtd. Sept 19, Sept 26, Oct 03, Oct 10, Oct 23, Nov 07, Dec 05 and Dec 19, 2004. Please click here to view previous reports. The chart shows the stock having a month long support at the 344 levels as the trend-line indicates. The scrip is consolidating between the 345 - 359 band and a breakdown below the 344 levels especially on a closing basis with higher volumes will result in a short term fall. Aggressive traders may await the breakdown and short the scrip in a weak market scenario.
Your call of action -
-
Investors / cash segment players - n/a.
-
Aggressive F&O traders - we advocate selling the February futures once the spot falls below the 344 levels conclusively and the markets are weak. Hold with a Rs 7 - 8 stop loss and expect to book profits at the 330 - 334 band.
-
Derivatives contract size - Market lot = 1,350 shares. F&O margin = approx Rs 84,000 (subject to change daily )
Arvind Mills I BPCL I Glaxo I HDFC Bank I Hind lever I HPCL I IPCL I Ranbaxy I Raymond I Telco I Tisco I Tata Power I BSE Sensex I Nifty I CNX-IT I Dow Jones I Nasdaq I FTSE I Top I Close window I Print page
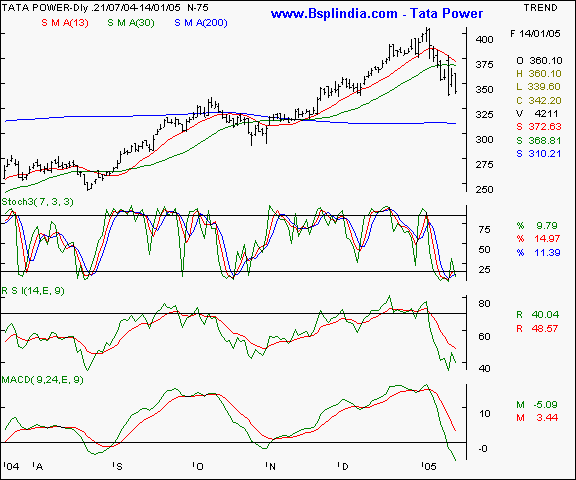
Tata Power - this scrip was recommended vide our earlier editions Dtd. Sept 12, Sept 26, Oct 03 and Nov 14, 2004. Please click here to view previous reports. The noteworthy aspect is the multiple support at the 335 levels since mid November 2004. If the scrip bounces back from those levels, a level of 350 can be seen. If a breakdown occurs, the scrip can react lower by 10 - 15 Rupees. We recommend a short sale subject to a confirmatory breakdown below the support.
Your call of action - .
-
Investors / cash segment players - n/a.
-
Aggressive F&O traders - short sell the February futures once the spot trades convincingly below the 335 levels and the overall markets are weak. Hold with a stop loss at the 347 mark. Expect to book profits at the 322 - 325 levels.
-
Derivatives contract size - Market lot = 800 shares. F&O margin = approx Rs 56,000 (subject to change daily )
Arvind Mills I BPCL I Glaxo I HDFC Bank I Hind lever I HPCL I IPCL I Ranbaxy I Raymond I Telco I Tisco I Tata Power I BSE Sensex I Nifty I CNX-IT I Dow Jones I Nasdaq I FTSE I Top I Close window I Print page
|
Indices - domestic |
BSE Sensex - the sensex is showing a steep decline below it's short / medium term averages. There exists a possibility of a pullback rally, which is confirmed only if the Sensex manages to close a session above the 6250 mark. On the flip side, a fall below the 6084 levels on a closing levels will see a 2 - 3 % fresh fall in the near term. Traders should await a clear trend indication before acting in the markets.
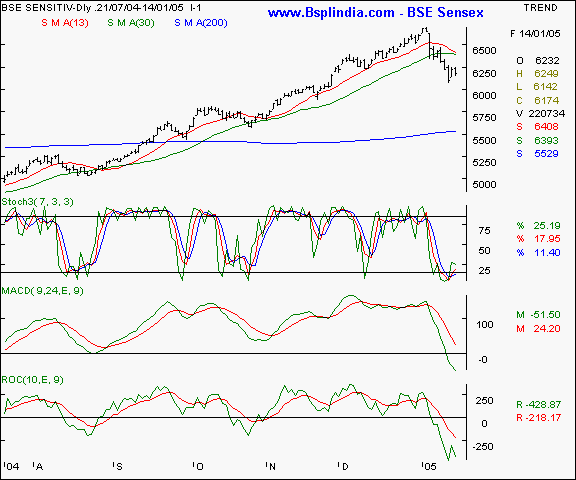
Your call of action - Since the Sensex futures are not very liquid, we suggest trading the Nifty 50 instead.
Arvind Mills I BPCL I Glaxo I HDFC Bank I Hind lever I HPCL I IPCL I Ranbaxy I Raymond I Telco I Tisco I Tata Power I BSE Sensex I Nifty I CNX-IT I Dow Jones I Nasdaq I FTSE I Top I Close window I Print page
Nifty 50 - the Nifty's chart is similar to the Sensex and a pullback is possible if the index closes above the 1966 levels with higher volumes. The upward resistance areas would be the 1988 and then the 2004 levels. On the flip side, expect the fall below the 1930 levels to take the Index to the 1912 / 1918 levels and a fall below the 1900 levels will see the 1880 - 1888 mark.
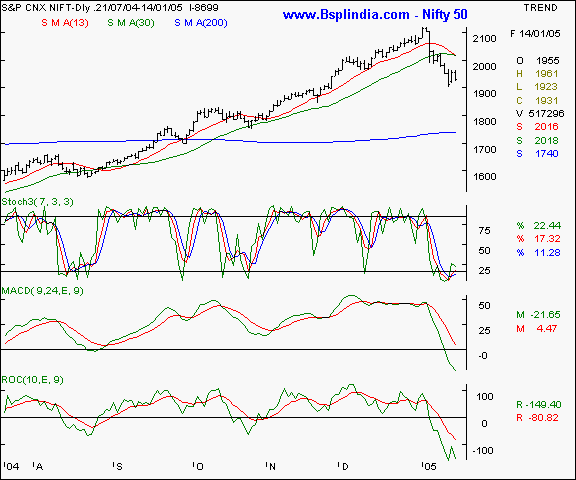
Your call of action - Await a clear direction in the index and take positions accordingly. A surge past the 1966 levels will be a sign of strength and a conclusive close below the 1930 is a sign of weakness. All trades must be initiated in the February futures after adjusting for premium / discount to the spot rates mentioned above.
Arvind Mills I BPCL I Glaxo I HDFC Bank I Hind lever I HPCL I IPCL I Ranbaxy I Raymond I Telco I Tisco I Tata Power I BSE Sensex I Nifty I CNX-IT I Dow Jones I Nasdaq I FTSE I Top I Close window I Print page
CNX IT - this IT index is trading below it's 13 week SMA for the first time in 6 months and that is sign of weakness. The index can fall all the way to the 2565 mark in case the composite stocks do not recover in the near term. On the upsides, the 2820 will be a resistance area.
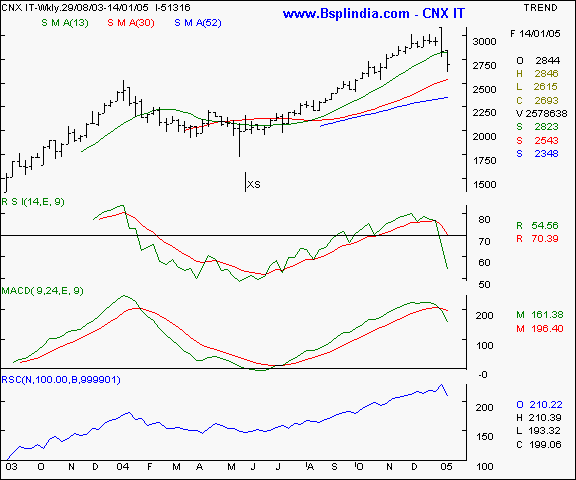
Your call of action - Since the Sensex futures are not very liquid, we suggest trading the Nifty 50 instead.
Arvind Mills I BPCL I Glaxo I HDFC Bank I Hind lever I HPCL I IPCL I Ranbaxy I Raymond I Telco I Tisco I Tata Power I BSE Sensex I Nifty I CNX-IT I Dow Jones I Nasdaq I FTSE I Top I Close window I Print page
|
Indices - international |
Dow Jones Industrial Average - The Dow is retracing lower and likely to derive immediate support at the 10400 levels. It is crucial that this index not fall & close below the 10400 levels in the coming weeks if any recovery is to be seen. On the upsides, the 10715 levels will be the immediate resistance levels to watch.
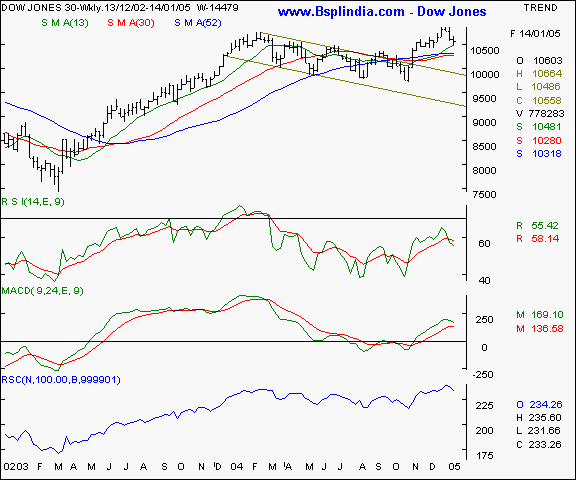
Your call of action - Since Indian investors are not allowed to trade in overseas markets, this is a pure academic study.
Arvind Mills I BPCL I Glaxo I HDFC Bank I Hind lever I HPCL I IPCL I Ranbaxy I Raymond I Telco I Tisco I Tata Power I BSE Sensex I Nifty I CNX-IT I Dow Jones I Nasdaq I FTSE I Top I Close window I Print page
Nasdaq - The IT / Biotechnology laden index is showing a sharp retracement in the previous fortnight and is currently at it's threshold support at the 2075 levels. A conclusive fall below this level will see support at the 2000 levels. On the higher side, expect resistance at the 2125 levels.
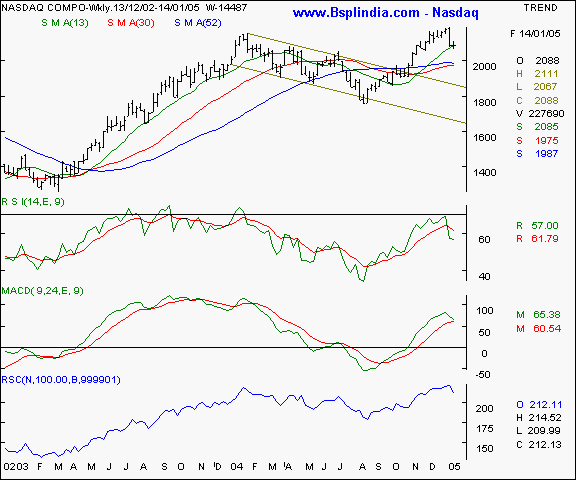
Your call of action - Since Indian investors are not allowed to trade in overseas markets, this is a pure academic study.
Arvind Mills I BPCL I Glaxo I HDFC Bank I Hind lever I HPCL I IPCL I Ranbaxy I Raymond I Telco I Tisco I Tata Power I BSE Sensex I Nifty I CNX-IT I Dow Jones I Nasdaq I FTSE I Top I Close window I Print page
FTSE - this UK index is showing higher relative strength as compared to the US indices as the fall has been relatively muted. The 4720 levels will be the threshold support to watch in the coming week and 4875 levels to watch on the upsides.
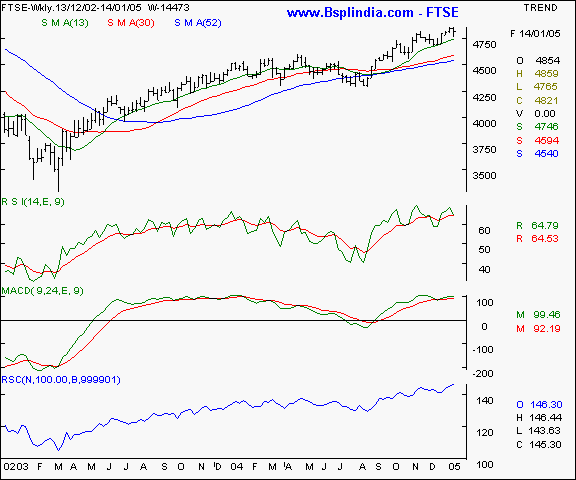
Your call of action - Since Indian investors are not allowed to trade in overseas markets, this is a pure academic study.
Arvind Mills I BPCL I Glaxo I HDFC Bank I Hind lever I HPCL I IPCL I Ranbaxy I Raymond I Telco I Tisco I Tata Power I BSE Sensex I Nifty I CNX-IT I Dow Jones I Nasdaq I FTSE I Top I Close window I Print page
|
Trading tips for the week |
-
The put / call ratio is easing and is currently at the 0.23 : 1 levels and the outstanding positions in the derivatives segment have shown a qualitative degeneration. The FII investments are continuing to remain negative.
-
There is offloading at higher levels in stock futures. That indicates a cautious approach as long positions in individual stocks is being hedged by Nifty shorts.
-
The current week is crucial for the markets as the 1910 - 1930 supports will decide the near term fate of the markets.
-
The impeding expiry of the January series will see offloading and higher volatility in the near term. Due to holidays before the expiry, the trading sessions left before expiry are fewer.
-
Trades must be executed in minimum lots only, due to the higher volatility expected. Trade fewer counters and conserve cash for future opportunities.
-
Standby for fresh recommendations via SMS on a real - time basis.
- Have a profitable week.
- Vijay L Bhambwani
- Ceo :- Bsplindia.com
The author is a Mumbai based investment consultant and invites feedback at Vijay@BSPLindia.com and ( 022 ) 23438482 / 23400345.
SEBI disclosure :- The author has no positions in any securities mentioned above.
- While all due care has been taken while in compiling the data enclosed herein, we cannot be held responsible for errors, if any, creeping in. Please consult an independent qualified investment advisor before taking investment decisions. This mail is not sent unsolicited, and only advisory in nature. We have accepted no consideration from any company mentioned above and recommend taking decisions on merits of the stocks from our viewpoint. This email is being sent to you as a paid subscriber. Please protect your interests and ours by not disclosing the contents to any un-authorised person/s
Legal notice :- The Professional Ticker Reader is a trademark of Bhambwani Securities (P) Ltd. and any un-authorised replication / duplication in part or full will be infringing our trademark and will result in legal action being enforced on the infringing persons / parties.