Dow
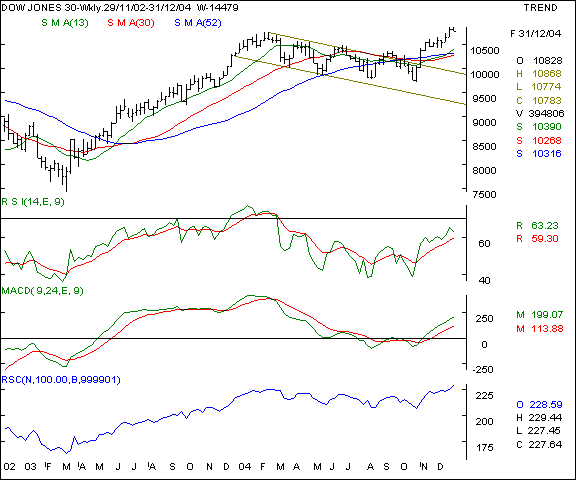
Jones Industrial Average - this NYSE old economy benchmark has
run into resistance at the 10868 levels on lower volumes and profit sales
by bulls on year end considerations. The outlook in the week ahead remains
positive and we expect support at the 10625 levels in the coming week. A
fresh bullishness is unlikely till the index closes above the 10870 levels
with higher volumes. The Dow currently trades near it's 3 1/2 year highs.

Your
call of action - Since Indian
investors are not allowed to trade
in overseas markets, this is a pure
academic study.
Nasdaq
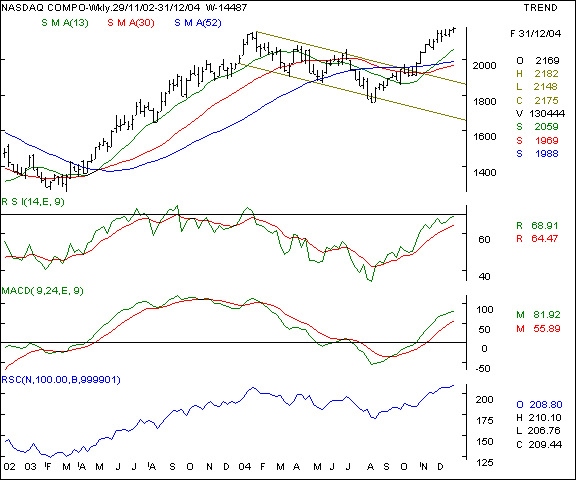
- the Nasdaq has also made a similar chart pattern as the Dow Jones index
above and is currently trading at it's 3 1/2 yearly highs. The breakout
from the bearish channel is now a confirmed flag formation and enables a
projected target of 2240 levels in the short / medium term in a conducive
market scenario. The 2130 levels remain a critical support to watch.

Your
call of action - Since Indian investors are not
allowed to trade in overseas markets, this is a pure academic study.
FTSE
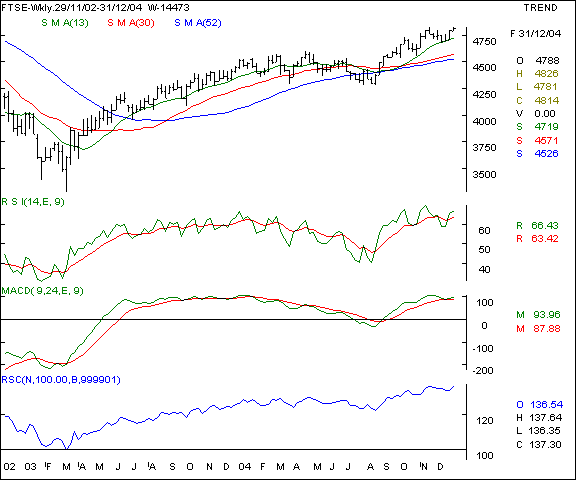
- this UK index has shown higher relative strength as compared to the US
indices as the FTSE nears a congestion level of 4845 levels. Only above a
conclusive close over this level will the index witness a fresh rally. On
the lower side, expect support at the 4740 levels.

Your
call of action - Since Indian
investors are not allowed to trade
in overseas markets, this is a pure
academic study.