Global market indices - weekly feature - Jan 09, 2005
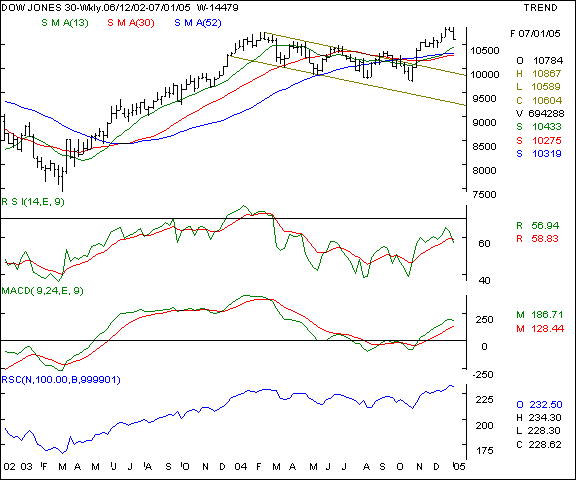
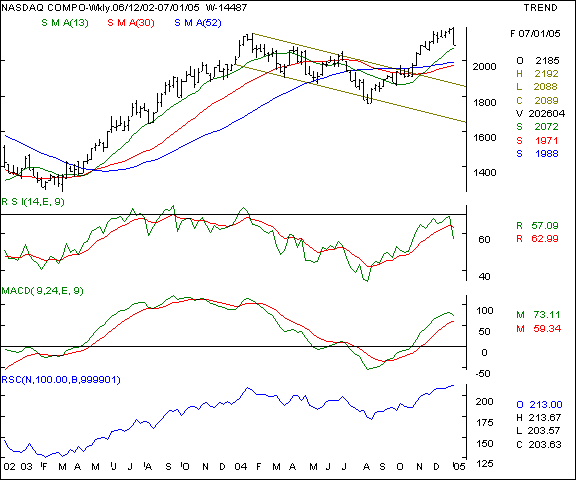
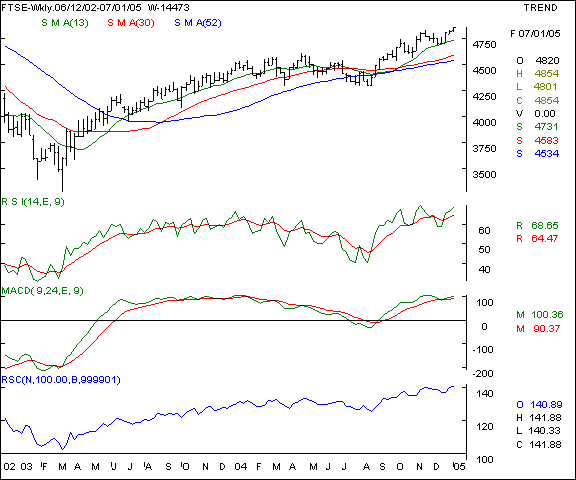
Dow Jones Industrial Average - this US index has retraced from it's resistance point at the 10850 mark and closed near it's fortnightly lows. We expect a good support at the 10475 levels where the fall should stem. On the upsides, watch the 10740 levels in the coming week. Your call of action - Since Indian investors are not allowed to trade in overseas markets, this is a pure academic study. Nasdaq - the Nasdaq exhibits a similar chart pattern as the Dow, only the fall is much more pronounced. The 2070 levels will be the immediate support and the index is now trading at the 5 week lows. Upsides are likely to be met with resistance and we advocate a weak outlook on this index. That will have a bearing on the domestic technology counters. The upsides are likely to be capped at the 2144 levels. Your call of action - Since Indian investors are not allowed to trade in overseas markets, this is a pure academic study. FTSE - this UK index is showing signs of relative out-performance as compared to the US indices. The index has closed above it's congestion levels and hit a new high since July 2002. We foresee a support at the 4755 levels in the coming week, with resistance at the 4920 on the upsides. Your call of action - Since Indian investors are not allowed to trade in overseas markets, this is a pure academic study. |
Your feedback is important ! Please click here to let us know your views. Click here to inform a friend about this page on our website.


