Global market indices - weekly feature - Jan 23, 2005
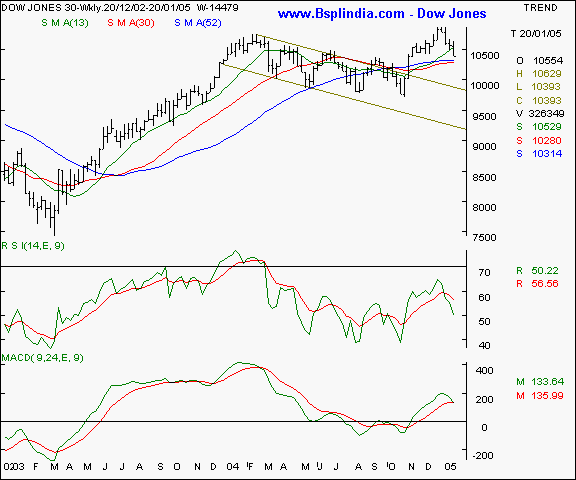
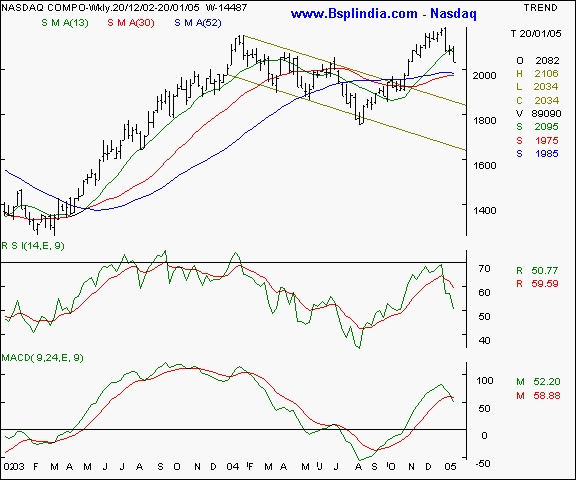
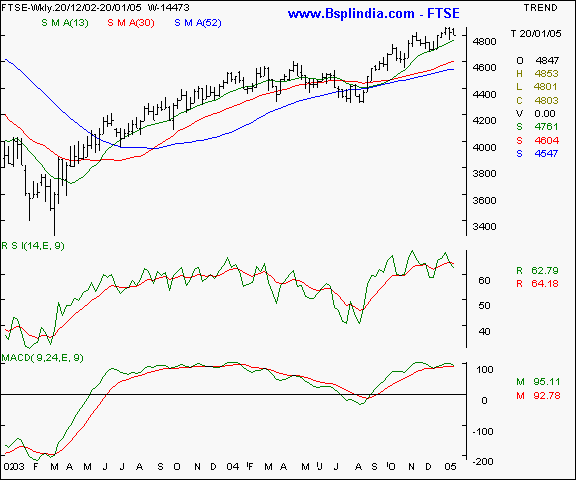
Dow Jones Industrial Average - the Dow Jones average is showing a lower close for the third week running and is at near 4 month lows. The crucial test will be the 10,280 - 10,300 levels. Should these be violated, there could be further falls to the 10,040 levels. On the upside, watch the 10,650 levels for resistance. Your call of action - Since Indian investors are not allowed to trade in overseas markets, this is a pure academic study. Nasdaq - the Nasdaq is making similar chart patterns like the Dow Jones and is at near 4 month lows too. The 2000 levels are likely to be tested and the 2100 levels need to be cleared convincingly to signal a reversal of the weakness. Your call of action - Since Indian investors are not allowed to trade in overseas markets, this is a pure academic study. FTSE - This UK index is making better patterns as compared to the US markets and is likely to derive support at the 4750 levels. On the upsides, we expect resistance at the 4865 levels which need to be cleared convincingly to signal a fresh upmove. Your call of action - Since Indian investors are not allowed to trade in overseas markets, this is a pure academic study. |
Your feedback is important ! Please click here to let us know your views. Click here to inform a friend about this page on our website.


