- Your accurate, authentic and affordable guide to investing
July 01, 2005
-
- Are the bears getting it all wrong ?
- Yes, say the charts !
The markets have confounded many an analyst - both fundamental and technical, in the last two quarters. While the markets yo-yo'd between January - April, may analysts brought out their knives and wrote elaborate obituaries on the bulls' demise. There is a school of thought that the great Indian share bazaar bull phase is in it's final death throes and the current upmove is nothing but the farewell gasp of the dying bull. We have been faced with this question since the last six months and we commit ( for the fourth time in the same time frame - click here to view these reports dated January 27 2005, January 30 2005 and finally on March 27 2005 ) that the bulls are alive and kicking and what is more, likely to gore the bears for a while to come. It maybe noted that the last report of March was published in the Smart Investor ( Business Standard ) in the first week of April with the title " Sensex and sensibility".
|
The skeptics' arguments |
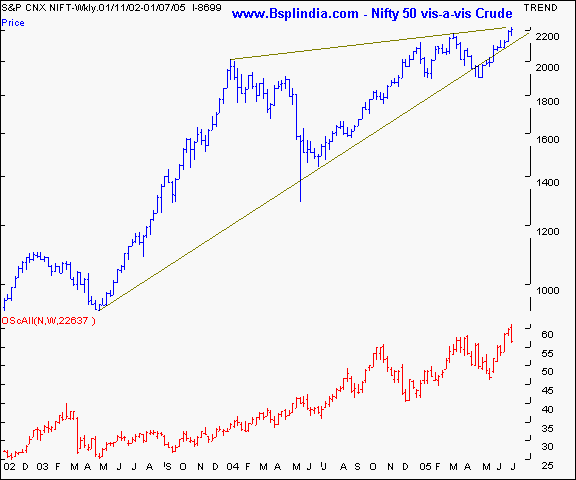
1) The biggest justification by the bears for a clear top in the markets today is the sizzling hot price of crude oil. While estimates vary from 68 $ to 100 $ within 12 - 18 months, it is clear that a fall below $ 50 mark is difficult. In case history is as good a teacher as any, the recent India specific bull run spanning over 24 months saw the oil prices more than double in the same period. The rally was not an isolated example but a worldwide phenomena. Going by the efficient market hypothesis, the prices factor in the imponderables into the current valuations. The markets know best and that too, way ahead of public knowledge. The only difference higher crude oil prices would make to our projections is to probably taper down the upper targets a wee bit and hedge long positions by shorting the refinery scrips on advances.
2) Higher interest rates in the USA will see a drain on the India investment story - in the short run, probably a sentiment hit maybe. But it must be noted that a weakening USD will mean that FII's have little or no choice but to invest in the Indian markets. A fall below the 43.20 levels against the INR will take the USD to the 41 mark fairly easily. Any interest rate hike will be negated by the weak currency.
3) Crude prices will continue to rise perpetually - our findings after interacting with sector analysts indicate that alternate fuels which were hitherto unviable commercially, will become the defacto hope for an energy hungry world if oil prices continue to rally at this rate of change. Oil producing countries know this too. It is not really in their favour to keep oil prices buoyant perpetually. After the oil shock of the 1970's, prices of all commodities & currencies have risen. But oil has risen at a slower rate, which is now playing catch up. A marginal " terror premium" may also be getting factored in the prices, keeping in mind the fluid situation in Iran, Iraq and Nigeria.
4) The current rally in equities is on poor volumes - very true ! But does it worry you ? Well it should not. Over a year ago, you only had the BSE vying with the NSE for your attention as far as tradable instruments were concerned. Now you have the commodities exchanges. Since resources are limited and more avenues are available, a shift from equities was inevitable. Also noteworthy is the fact that a large number of BSE & NSE members are members of the commodities exchanges and a transition is fairly smooth. Another case in point are the rising volumes on these exchanges. Check out - www.Mcxindia.com and www.Ncdex.com
|
Technicals - where are we now ? |
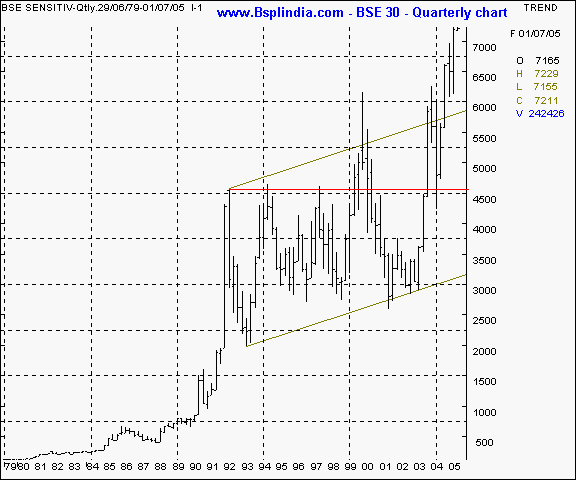
The quarterly bar chart of the Sensex shows a 36 x appreciation in the Sensex between 1979 to 1992. Those were the days when rights issues were mini bonuses as the controller of capital issues controlled issue prices. India Inc was growing rapidly and the equity culture was booming. A good blue chip doubled your money every 2 - 3 years. Things changed after the 1992 securities scam. The markets went in a limbo for 12 years ( see graphic below ) barring the 1999 - 2000 bull run. A breakout from this phase started in 2003 when the upward momentum picked up again. We feel a power uptrend is in it's formative stages which will bring back the rapid appreciation phase. Savvy investors will be able to double their money every 2 - 3 years with smart investments. It should be noted that the chart below is a quarterly chart and every bar represents 3 months of trade. Trying to use this chart for daily / short term trades can be extremely hazardous. In the short term, sharp corrections are expected.
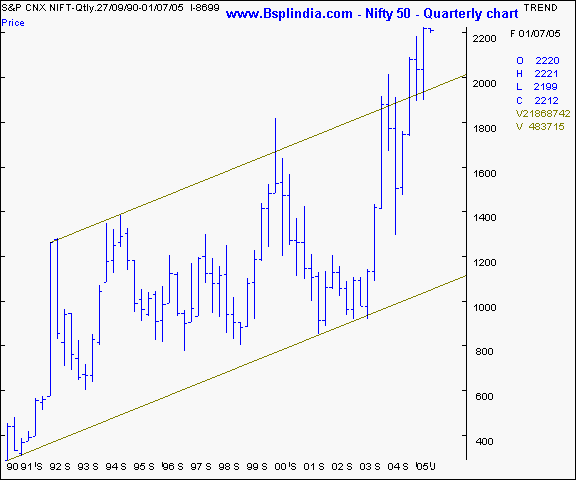
The quarterly chart of the Nifty below shows a bullish pattern as the higher tops and bottoms formation is seen since the inception of the exchange. The index has been moving within a bullish channel and a breakout is seen after a decade and half of predictable trading behaviour. The breakout has been on higher volumes and the closing has been above the channel for 3 consecutive quarters. That is a sign of strength. We feel the 1900 levels are now the defacto support below which the Nifty must not close with higher volumes, if the upmove is to remain intact. It should however be noted that the bull market is not terminated unless the 1740 levels are violated ! It should be noted that the chart below is a quarterly chart and every bar represents 3 months of trade. Trying to use this chart for daily / short term trades can be extremely hazardous. In the short term, sharp corrections are expected.
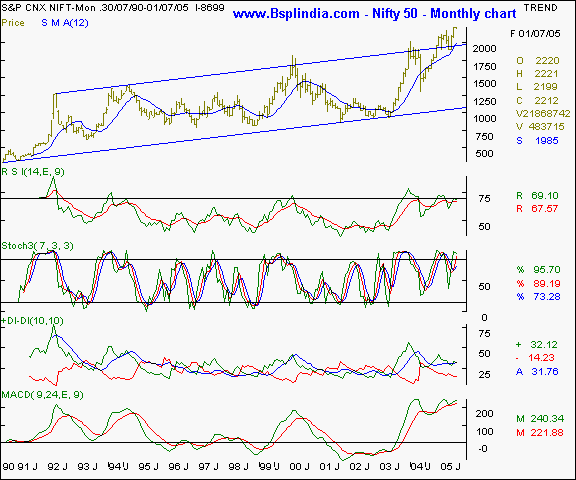
The monthly bar chart of the Nifty below shows a detailed pattern of the underlying sentiments. A higher tops and bottoms formation is confirmed and the trading volumes are picking. The SMA plotted as a blue line is in the northwards direction and the price graph is above the average line. The oscillators are supporting the rally and barring the expected vicious corrective falls, a major reversal is ruled out for now. It should be noted that the chart below is a monthly chart and every bar represents 1 month of trade. Trying to use this chart for daily / short term trades can be extremely hazardous. In the short term, sharp corrections are expected.
| Your call of action |
We feel the bias is clearly bullish and investors and traders need to remain long over the medium / long term. We also feel that buy & hold will work better as a strategy as compared to frequent trading. As advocated repeatedly, a pyramid style investment strategy should be adopted. A longer term portfolio approach should be considered even for the trading calls initiated. We have observed a sense of hesitation over initiating fresh buy calls. Remember - ships are safest in the harbour, but that is not what they were built for.
Your feedback is important ! Please click here to let us know your views. Click here to inform a friend about our website.
- Have a profitable day.
- Vijay L Bhambwani
- Ceo :- Bsplindia.com
The author is a Mumbai based investment consultant and invites feedback at Vijay@BSPLindia.com and ( 022 ) 23438482 / 23400345.
SEBI disclosure - The author has no positions in the stocks mentioned above.
- While all due care has been taken while in compiling the data enclosed herein, we cannot be held responsible for errors, if any, creeping in. Please consult an independent qualified investment advisor before taking investment decisions. This mail is not sent unsolicited, and only advisory in nature. We have accepted no consideration from any company mentioned above and recommend taking decisions on merits of the stocks from our viewpoint. This email is being sent to you as a paid subscriber. Please protect your interests and ours by not disclosing the contents to any un-authorised person/s.
Legal notice :- The Professional Ticker Reader is a trademark of Bhambwani Securities (P) Ltd. and any un-authorised replication / duplication in part or full will be infringing our trademark and will result in legal action being enforced on the infringing persons / parties.


