Global market indices - weekly feature - July 09, 2005
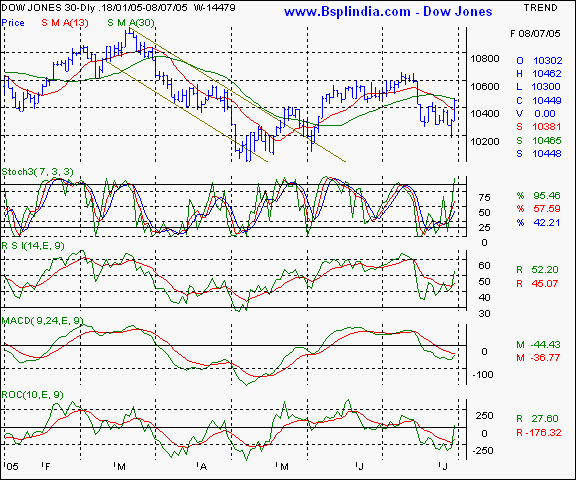
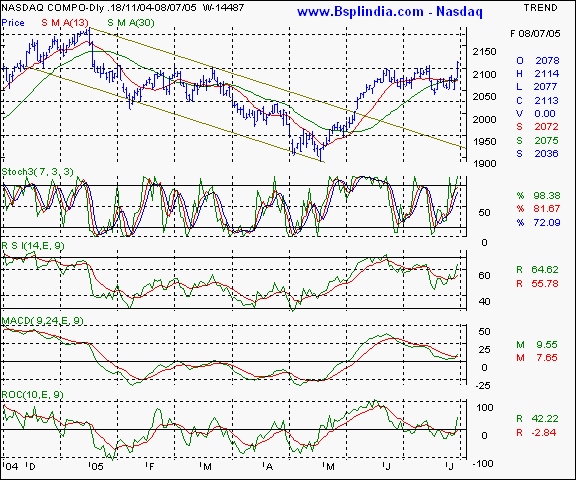
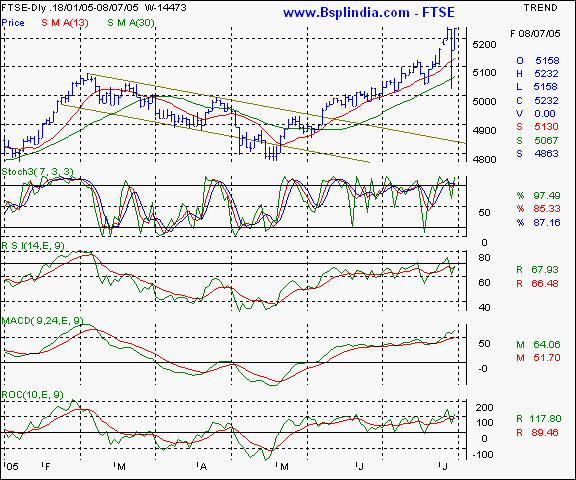
Dow Jones Industrial Average - this index is making an attempt to rally after a week of consolidation / correction. Staying above the 10425 levels is critical for the index to remain bullish. Heavier resistance is likely at the 10640 levels. On the lower side, the 10200 levels are a support area. Your call of action - this is a pure academic study. Nasdaq - This index is making a bullish pattern on the daily chart as the 2100 levels are surpassed on a closing basis. The 2100 levels are a multiple top since February and if the index manages to close above this threshold on a sustained basis, higher levels of 2154 are likely. On the lower side, expect support at the 2064 levels. Your call of action - this is a pure academic study. FTSE - this index is showing higher relative strength as compared to the US benchmarks. The 5240 levels are likely to be the resistance area to watch out for and the 5130 levels are the support in the immediate future. A higher tops and bottoms formation is in progress and it is important that the 5070 levels are not violated in the the coming fortnight. Upsides will see resistance at the 5365 levels. Your call of action - this is a pure academic study |
Your feedback is important ! Please click here to let us know your views. Click here to inform a friend about this page on our website.


