Global market indices - weekly feature - July 17, 2005
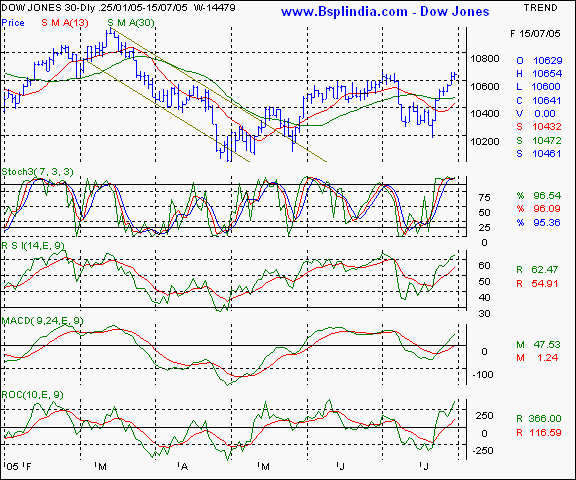
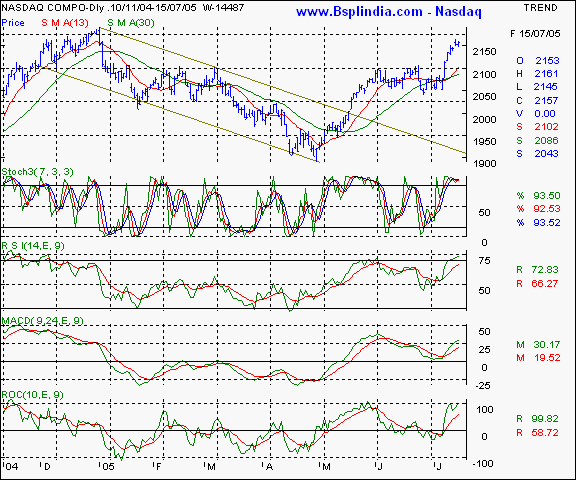
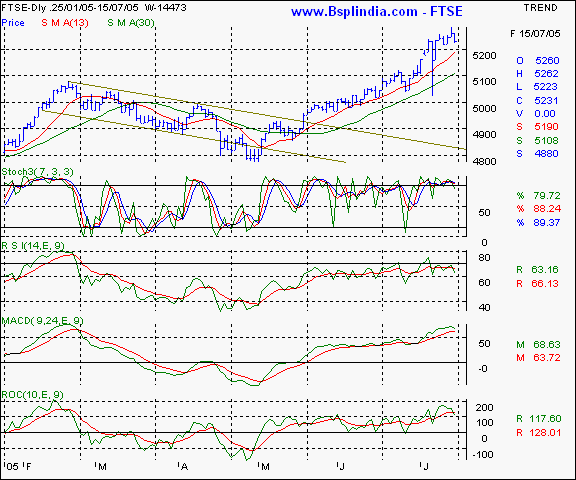
Dow Jones Industrial Average - this US old economy benchmark has shown a bullish pattern after the 10600 levels were surpassed amidst positive economic data. The 10480 levels are likely to be the short term support and the index may see 10785 levels in this week. Your call of action - this is a pure academic study Nasdaq - this index is showing a strong chart pattern as the previous week's forecast has been on target. A firm closing above the 2125 levels has been a confirmatory signal for the bulls and the 2222 levels maybe seen soon. Downsides are likely to see support coming in at the 2120 level. Your call of action - this is a pure academic study. FTSE - this UK benchmark is showing a highest closing after March 2002 on the quarterly charts and that is a bullish indicator. Support at lower levels will be seen at the 5160 levels and upsides may see 5370 in the coming week. Your call of action - this is a pure academic study |
Your feedback is important ! Please click here to let us know your views. Click here to inform a friend about this page on our website.


