Global market indices - weekly feature - July 31, 2005
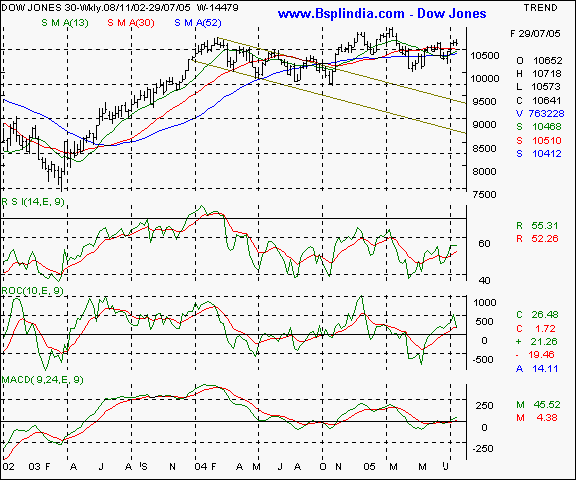
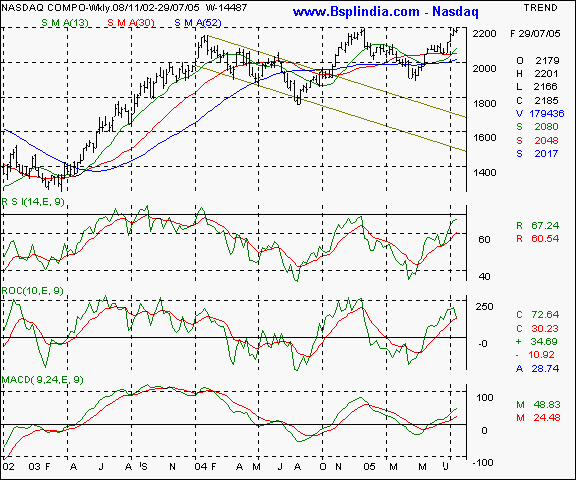
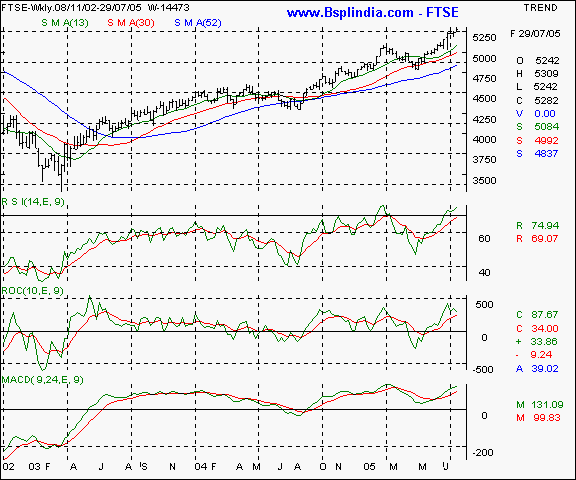
Dow Jones Industrial Average - this US NYSE benchmark is moving within a converging pattern as the lower support is at the 10340 and the top is at the 10710 mark. Only a sustained close above the 10775 will confirm the fresh uptrend that will probably test the 10940 - 11000 mark. Your call of action - this is a pure academic study. Nasdaq - this new economy US index is encountering resistance at the double top levels of 2200 - 2210. A sustained closing above this threshold on higher volumes will propel the index in a low resistance area and a fresh upmove will occur. Your call of action - this is a pure academic study. FTSE - this UK index is exhibiting strength as the index has managed a highest closing since quarter ended June 2001 on the quarterly charts. The pattern is that of higher tops and bottoms and with oscillator support. The support is likely at the 5140 mark and resistance at the 5420 levels in the coming weeks. Your call of action - this is a pure academic study. |
Your feedback is important ! Please click here to let us know your views. Click here to inform a friend about this page on our website.


