Relative Strength Comparative
|
Every school of analysis provides traders / investors a means of limiting the risk to their investible capital. Technical analysis offers a few wonderful tools of which, we check out the relative strength comparative ( RSC ). As the name suggests, it is a comparative measure of strength vis-a-vis a benchmark / share / sector. The best use you can put the RSC before you initiate a trade is to check out how your scrip has performed historically against the indices, it's peers in the same sector and / or a seperate asset class like say, commodities. To that effect, RSC helps in determining which scrip would be the most profitable investment. It should not be mixed up with beta ( volatility ) which measures bilateral movement. |
|
|
|
|
|
Learn to earn |
Highly volatile scrips rise or fall faster than the indices, but may not make large net moves in any single direction. On the other hand, high RSC scrips will rise faster than the indices but fall slower than the indices in a downturn. To that extent, they are solid market out performers and have a uni-directional movement - upwards ! Needless to say, buying scrips with the highest RSC reading among the available choice of stocks will ensure a greater probability of capital appreciation.
The RSC is plotted like an oscillator in a smaller window below the price graph. It has an equilibrium line ( a threshold line ) and an oscillator that reads below / above the equilibrium line. Readings above the equilibrium denote a high RSC and below, show a low RSC. The longer the time frame that a scrip has enjoyed a high RSC reading, the more appreciation it has witnessed. Such scrips are investors' "fancied" stocks. Avoid scrips where the RSC has recently surpassed the threshold / equilibrium line. The logic being - a trend reversal or whipsaw will take the stock back to where it started from ! So stick to stocks that have stood the test of time.
A word of caution though - like any other oscillator, this one too should not be taken as a be all and end all or a panacea drug. Other technical considerations must also be taken into account to ensure a sound trade / investment.
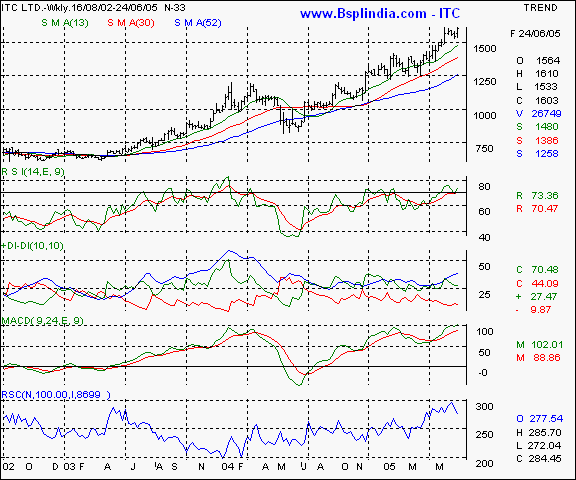
Real life example - ITC Ltd below is shown in a weekly chart with a RSC reading of 277.54 ( where 100 = equilibrium ). It should be noted that ITC has risen 2.7754 times faster than the Nifty 50 and proved itself to be a strong market out-performer. Also note, the reading has never fallen below 200 in the last 3 years covered by the graphic.
Have a profitable trade !
- Vijay L Bhambwani
- Ceo - Bsplindia.com
The author is a practicing technical analyst and invites feedback at vijay@Bsplindia.com or ( 022 ) 23438482 / 23400345.
Your feedback is important ! Please click here to let us know your views. Click here to inform a friend about this page on our website.

