Global market indices - weekly feature - June 05, 2005
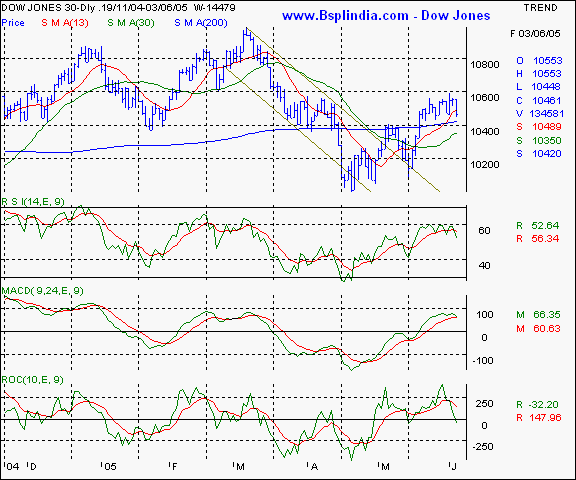
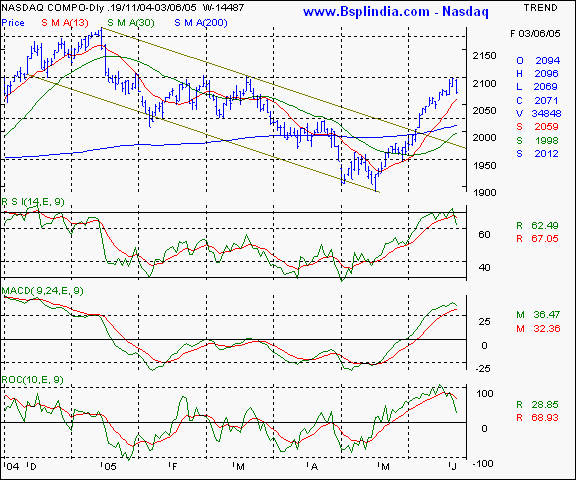
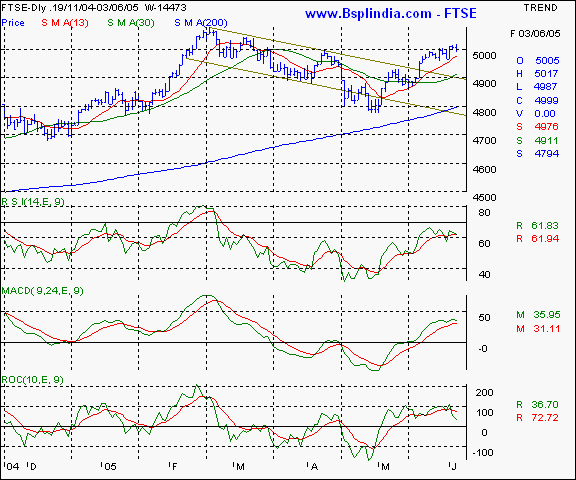
Dow Jones Industrial Average - the 10600 levels are proving to be a strong hurdle for the Dow and the index is currently trading above the 200 day SMA placed at the 10420 levels. As long as this level is not violated, expect bullishness. A drop below this level will see 10310. Your call of action - this is a pure academic study. Nasdaq - the Nasdaq has broken out above the bearish channel and encountered resistance at the 2100 levels as forecast last week. Support at the lower end will be seen at the 2035 - 2042 band below which, the outlook will be weak. Your call of action - this is a pure academic study. FTSE - this Index is out performing the US indices and needs to trade above the 5000 mark to gain upward momentum. The support is likely to be seen at the 4915 in the absolute near term. This index is likely to perform better than the US market indices in the coming week in relative terms. Your call of action - this is a pure academic study. |
Your feedback is important ! Please click here to let us know your views. Click here to inform a friend about this page on our website.


