Global market indices - weekly feature - June 12, 2005
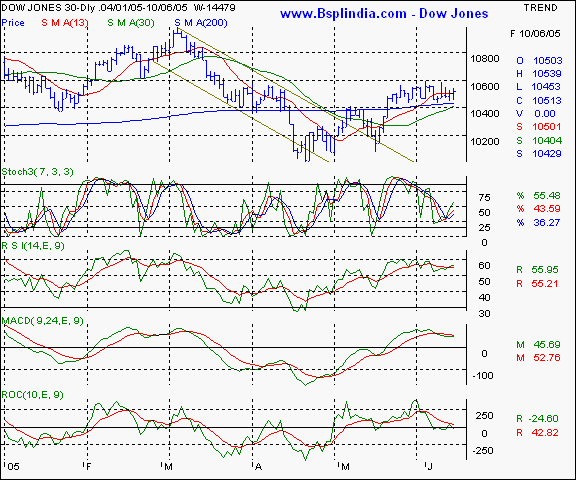
Dow Jones Industrial Average - this NYSE index is showing signs of consolidation after breaking out of the bearish channel formation. Currently trading above it's 200 day SMA, the index is likely to encounter resistance at the 10600 mark. Support at lower levels will be seen at the 10414 levels.
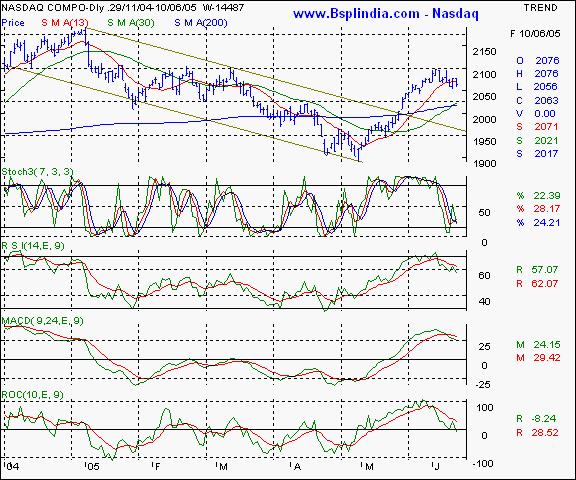
Your call of action - this is a pure academic study. Nasdaq - this technology laden index is showing signs of fatigue at higher levels as the 2100 levels are acting as a strong resistance for this benchmark. The oscillators are pointing towards a weak undertone and any sustained trade below the 2050 levels will be a sign of bearishness. The immediate support will be the 2020 levels.
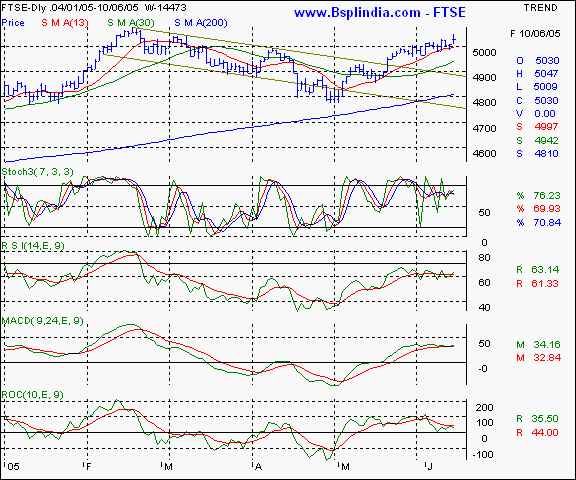
Your call of action - this is a pure academic study. FTSE - this index has shown higher relative strength as the UK benchmark approaches it's previous top at the 5077 levels. The oscillators are pointing towards an optimistic outlook and the further upmoves cannot be ruled out. Support in the near term will be seen at the 4964 levels.
Your call of action - this is a pure academic study.. |
Your feedback is important ! Please click here to let us know your views. Click here to inform a friend about this page on our website.