Global market indices - weekly feature - June 19, 2005
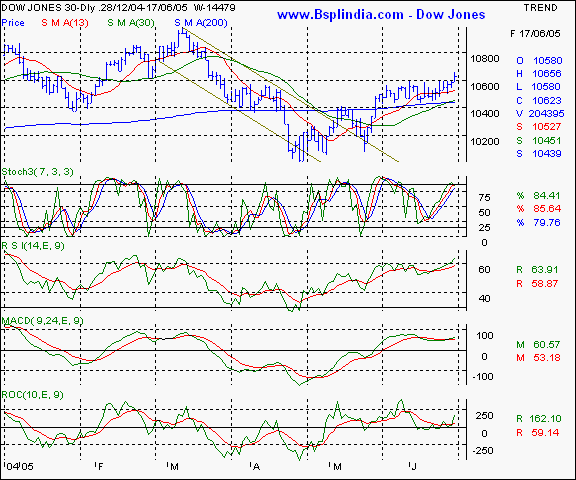
Dow Jones Industrial Average - this NYSE benchmark is showing signs of rallying inspite of the higher crude prices and inflationary concerns. The crucial 10600 threshold has been surpassed and the index is trading at 3 month highs. The support is now likely to be seen at the 10475 levels and resistance at the 10765 levels. The oscillators are displaying a bullish outlook for now.
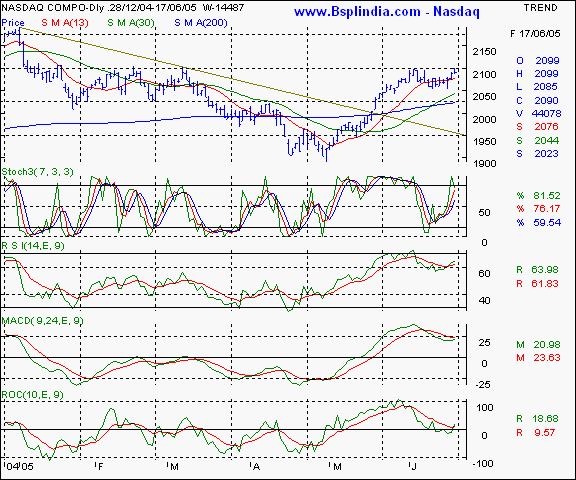
Your call of action - this is a pure academic study. Nasdaq - this technology laden index is in a bullish groove and within kissing distance of the 2100 psychological barrier. The 2052 levels will be support area and the 2110 levels which are a historic multiple top resistance formation need to be surpassed on a consistent basis to to see a fresh upmove to the 2160 levels. The outlook appears positive for now.
Your call of action - this is a pure academic study. FTSE - this UK index is showing higher relative strength as compared to the US indices and has actually started trading above the congestion threshold of the 5070 mark. The 5030 levels will be the immediate support and the 5162 will be the short term price objective. Our outlook remains positive, barring profit sales at higher levels.
Your call of action - this is a pure academic study |

Your feedback is important ! Please click here to let us know your views. Click here to inform a friend about this page on our website.