- Your accurate, authentic and affordable guide to investing
Flavours of the week March 06, 2005
These are stocks that we expect to out-perform the markets. Cash and derivative strategies are advised thereon. Please stay online to enable loading of graphics from our servers. Please also read the trading tips section at the end of the newsletter.
|
Individual stocks. |
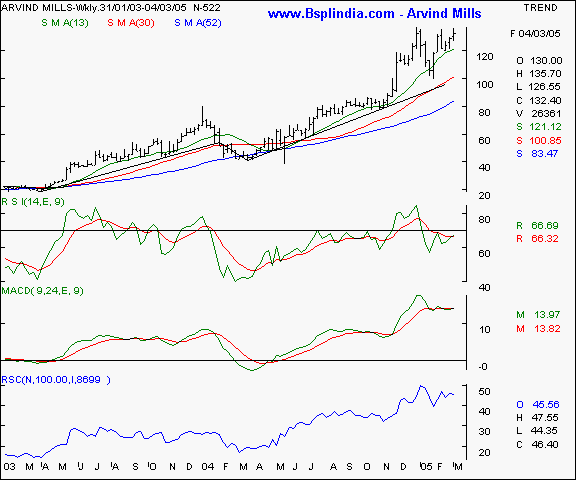
Arvind Mills - this scrip was recommended frequently in our earlier editions dtd Sept 05 2004, Oct 10 2004, Jan 16 & 22 2005. Click here to view the previous recommendations. The scrip was advocated to encounter resistance at the 140 levels which is a threshold level as per the time price charts. Any breakout above this level on a sustained closing basis will propel the stock into a low resistance area where upmoves can be accelerated. Chartically speaking, the 147 levels are a breakout from a 10 week congestion level. The oscillators are signaling a consolidation, an upward breakout on the price graph will trigger a buy signal on the MACD. The stock is trading in a rising tops and bottoms formation and is bullish in it's outlook.
Your call of action -
-
Investors / cash segment players - Buy the scrip for delivery at the current levels and hold with a liberal stop loss at the 110 - 115 levels. Expect to book profits at the 175+ levels in the medium term and significantly higher levels over the long term.
-
Aggressive F&O traders - Buy the March futures ( quoting at Re 1 premium to cash ) above the 138 levels and hold with a stop loss at the 133 / 134 levels. The position can be hedged by selling the March 145 calls at a premium of Rs 3. Income conscious players can try and sell the March 110 puts at a suggested premium of Re 1.
-
Derivatives contract size - Market lot = 4,300 shares. F&O margin = approx Rs 1,11,000 (subject to change daily )
Arvind Mills I Bajaj Auto I BEL I BHEL I Grasim I HDFC I ITC I Reliance Inds I Tata Tele I Tisco I BSE Sensex I Nifty I CNX-IT I Dow Jones I Nasdaq I FTSE I Top I Close window I Print page
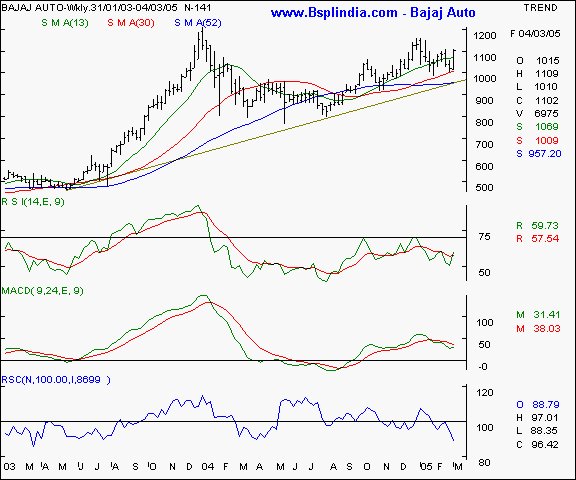
Bajaj Auto - this scrip was recommended vide our earlier editions dtd Sept 19 & 26 2004, Oct 10 2004, Dec 05, 12, 19 & 26 2004 and Jan 01 & 31 2005. Click here to view the previous recommendations. This scrip is moving along the rising trendline and making higher bottoms and tops formation. Of late this scrip has been an underperformer as the relative strength index shows. The scrip must close above the 1125 levels consistently with higher volumes to signal a bullish trend. Once the previous highs of 1160 are cleared, we expect the stock to clear the 1210 levels in a short while. We recommend a buy for the patient portfolio investor.
Your call of action -
-
Investors / cash segment players - buy the stock in small lots at current levels and keep room for averaging upto the 1040 levels. Keep a stop loss at the 1015 levels. Expect to book profits at the 1250 + levels in a few months time frame in a conducive market. Longer term players can expect higher levels.
-
Aggressive F&O traders - buy the March futures only if the spot price remains above the 1100 levels for atleast 3 sessions in a row. Maintain a stop loss at the 1065 levels and expect to book profits at the 1160 - 1165 levels. Options players have no choice due to liquidity problems on the counter.
-
Derivatives contract size - Market lot = 400 shares. F&O margin = approx Rs 69,000 (subject to change daily )
Arvind Mills I Bajaj Auto I BEL I BHEL I Grasim I HDFC I ITC I Reliance Inds I Tata Tele I Tisco I BSE Sensex I Nifty I CNX-IT I Dow Jones I Nasdaq I FTSE I Top I Close window I Print page
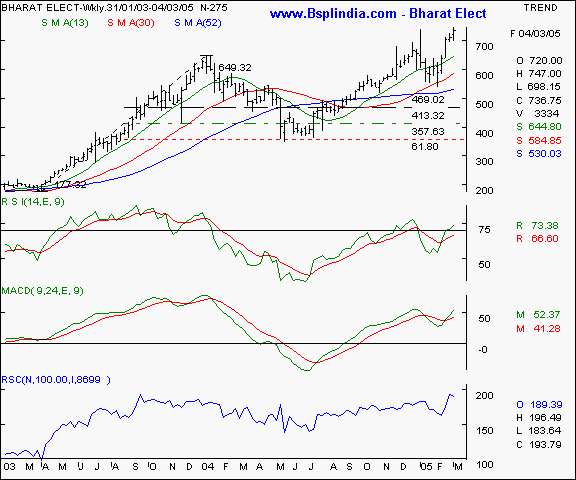
Bharat Elect - this superlative stock was recommended vide our earlier editions dtd Sept 19 2004, Oct 03 2004, Nov 07, 14 & 27 2004, Dec 19 2004 and Feb 20 & 27 2005. Click here to view the previous recommendations. The scrip has witnessed a good run upwards and rewarded bulls handsomely. The scrip has broken out into new highs and a zero resistance trading zone where upmoves are likely to be accelerated. Technical traders may note that the scrip has a high relative strength of 189 ( where 100 = base ) and the oscillators are pointing towards a bullish outlook. We expect a price target of 800 + levels in the medium term and recommend a buy.
Your call of action -
-
Investors / cash segment players - buy at the current levels and hold with a stop loss at the 680 levels. Expect book profits at the 800 levels in the medium term.
-
Aggressive F&O traders - Buy the April futures ( quoting at Rs 2 discount to cash ) at the current levels and hold with a deep stop loss at the 690 levels. Expect to book profits at the 775 - 780 levels in a conducive market in the medium term. Patient traders may expect even higher levels. Income conscious players with a higher risk appetite may attempt to sell the March 720 puts at a suggested premium of Rs 25. Options players may buy the March 720 calls at a premium of Rs 20.
-
Derivatives contract size - Market lot = 550 shares. F&O margin = approx Rs 69,000 (subject to change daily )
Arvind Mills I Bajaj Auto I BEL I BHEL I Grasim I HDFC I ITC I Reliance Inds I Tata Tele I Tisco I BSE Sensex I Nifty I CNX-IT I Dow Jones I Nasdaq I FTSE I Top I Close window I Print page
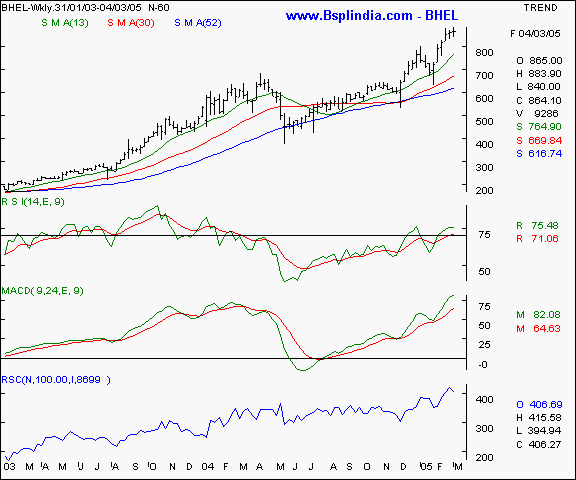
BHEL - This scrip was recommended vide our earlier editions dtd Sept 05 2004, Oct 10, 2004, Dec 12 & 19 2004 and Jan 09 & 30 2005. Click here to view the previous recommendations. The scrip has performed exceedingly well and has out-performed the markets. Technical traders will note the relative strength of 407 ( where 100 = base ) and the rising tops and bottoms formation. The scrip is in a zero resistance zone and the upmove is backed by the oscillators which are signalling a high probability of further upmoves. We recommend a buy on the counter.
Your call of action -
-
Investors / cash segment players - Buy the scrip at current levels and hold with a stop loss at the 820 levels. Expect to book profits at the 900 + levels in the short / medium term and 950 in the long term.
-
Aggressive F&O traders - Buy the April futures ( quoting at Rs 6 premium to cash ) at the current levels at hold with a stop loss at the 835 levels. Expect to book profits at the 910 levels in the short term and 930 levels in a conducive market by April end. Options players can buy the 880 calls at a suggested premium of Rs 14.
-
Derivatives contract size - Market lot = 600 shares. F&O margin = approx Rs 86,000 (subject to change daily )
Arvind Mills I Bajaj Auto I BEL I BHEL I Grasim I HDFC I ITC I Reliance Inds I Tata Tele I Tisco I BSE Sensex I Nifty I CNX-IT I Dow Jones I Nasdaq I FTSE I Top I Close window I Print page
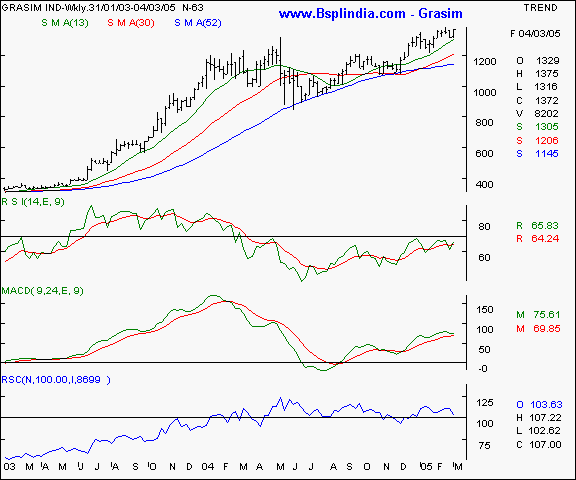
Grasim - this scrip was recommended vide our earlier editions dtd. Oct 31 2004, Dec 05 & 19 2004 and Jan 30 2005. Click here to view the previous recommendations. The stock has been good to patient investors, though short term / momentum players have had their patience tested by this counter. This scrip is a market out-performer of late and is trading near it's highs. The chart pattern suggests a breakout in the offing and the scrip derives excellent support at it's 13 week SMA. The higher tops and bottom formation imbibe confidence and we recommend a buy.
Your call of action -
-
Investors / cash segment players - buy at the current levels and hold with a stop loss at the 1320 levels. Expect profit taking at the 1450 - 1480 levels in the medium term. Longer term players can expect even higher returns.
-
Aggressive F&O traders - Buy the April futures ( quoting at Rs 27 premium to cash ) at the 1385 / 1390 levels. Hold with a stop loss at the 1350 levels, expecting to book profits at the 1450 levels in the short / medium term in a conducive market. Options players have no choice due to the poor liquidity on the counter.
-
Derivatives contract size - Market lot = 350 shares. F&O margin = approx Rs 75,000 (subject to change daily )
Arvind Mills I Bajaj Auto I BEL I BHEL I Grasim I HDFC I ITC I Reliance Inds I Tata Tele I Tisco I BSE Sensex I Nifty I CNX-IT I Dow Jones I Nasdaq I FTSE I Top I Close window I Print page
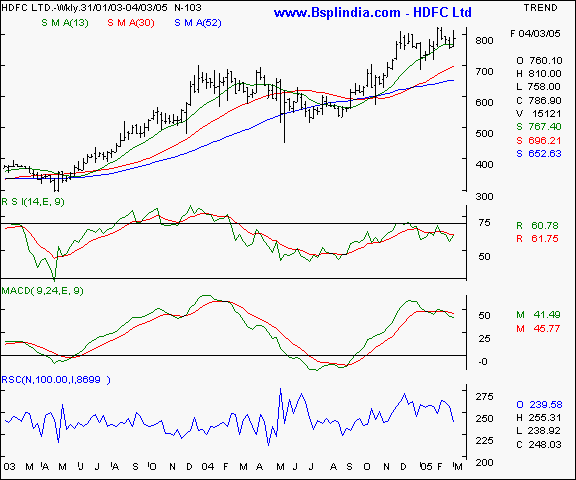
HDFC - this scrip was recommended vide our earlier newsletters dtd Nov 21 2004 and Feb 06 & 13 2005.Click here to view the previous recommendations. There has been some appreciation since the initial recommendation, though this scrip has been a quiet performer. Technical traders may note the high relative strength of 239 ( where 100 = base ) and the higher tops and bottoms formation. The scrip is near it's all time highs and a breakout will propel it into a faster upmove zone. We recommend a buy for the patient and disciplined investor / trader.
Your call of action -
-
Investors / cash segment players - Buy at the current levels and hold with a stop loss at the 740 levels. Expect to book profits at the 850 in the near / medium term and 900 + in the long term.
-
Aggressive F&O traders - Buy the April futures ( quoting at Rs 10 premium to cash ) at the current levels and hold with a stop loss at the 770 levels. Expect to book profits at the 844 levels in the short / medium term and 865 - 875 by expiry of the April contracts in a conducive market scenario. Options players can buy the March 800 calls at a suggested premium of Rs 15 in small lots only.
-
Derivatives contract size - Market lot = 600 shares. F&O margin = approx Rs 74,000 (subject to change daily )
Arvind Mills I Bajaj Auto I BEL I BHEL I Grasim I HDFC I ITC I Reliance Inds I Tata Tele I Tisco I BSE Sensex I Nifty I CNX-IT I Dow Jones I Nasdaq I FTSE I Top I Close window I Print page
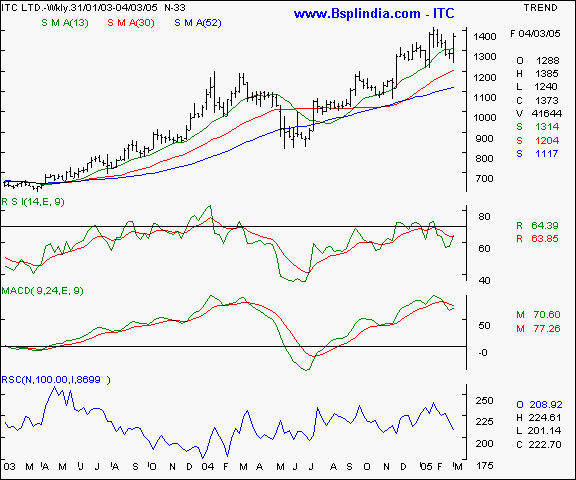
ITC - This scrip was recommended vide our earlier editions dtd Sept 12 2004 and Feb 06 & 27 2005. Click here to view the previous recommendations. The scrip has seen handsome appreciation since the initial recommendation and is likely to gain further. Technical traders may note the higher tops and bottoms formation, high relative strength of 209 ( where 100 = base ) and unfailing support at the 30 week SMA. Also note how the scrip is moving up in a wave like motion with subsequent bottoms being higher the previous one. The previous weeks low of 1240 satisfies that criteria and we feel the scrip is a medium term buy. A breakout above the 1400 mark will see a zero resistance area and a faster upmove.
Your call of action -
-
Investors / cash segment players - buy the scrip at the current levels and hold with a liberal stop loss at the 1290 levels. Expect to book profits at the 1475 - 1490 levels in a conducive market in the near / medium term.
-
Aggressive F&O traders - Buy the April futures ( quoting at Rs 3 discount to cash ) at the 1360 levels and hold with a stop loss at the 1325 mark. Expect to book profits at the 1410 + levels in a conducive market in the near term. Income conscious players can sell the 1290 March puts at a suggested premium of Rs 35 - 40 in small lots. Options players can buy the March 1410 calls at a suggested premium of Rs 15.
-
Derivatives contract size - Market lot = 300 shares. F&O margin = approx Rs 68,000 (subject to change daily )
Arvind Mills I Bajaj Auto I BEL I BHEL I Grasim I HDFC I ITC I Reliance Inds I Tata Tele I Tisco I BSE Sensex I Nifty I CNX-IT I Dow Jones I Nasdaq I FTSE I Top I Close window I Print page
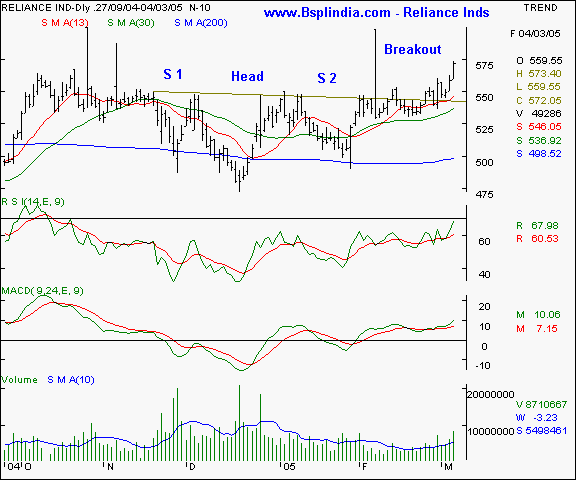
Reliance Inds - this scrip has simply been the star of the previous week and our perseverance on the counter paid off after 3 whipsaws on earlier occassions. The previous recos were dtd Sept 12 2004, Oct 23 & 31 2004, Nov 21 & 27 2004, Dec 05 2004, Jan 09 2005 and Feb 13 2005. Click here to view the previous recommendations. The same was elaborated in special newsletter on Friday Mar 04 2005. The scrip has signalled a confirmed inverted head and shoulder formation and the breakout has been accompanied with volumes above the 10 day average volumes. Being a measuring move, we feel the target of 600 + is valid in a conducive market and traders who have initiated long positions at the 552 levels can hold on with higher stop losses at the 558 levels and fresh entry is recommended in small lots at the 570 - 575 levels for the aggressive trader. The oscillators are confirming the upmove and the momentum build up is encouraging.
Your call of action -
-
Investors / cash segment players - Hold existing long positions and entry afresh at the 570 mark. Maintain a stop loss at the 558 levels and expect to book profits at the 590 - 600 levels in a conducive market.
-
Aggressive F&O traders - Buy the march futures at the 573 - 575 levels and hold with a stop loss at the 564 levels. Expect to book profits at the 585 - 595 levels in the short term in a conducive market scenario. Options players may buy the March 600 calls at Rs 5. Income conscious players may sell the March 540 puts at a suggested premium of Rs 4.50
-
Derivatives contract size - Market lot = 600 shares. F&O margin = approx Rs 57,000 (subject to change daily )
Arvind Mills I Bajaj Auto I BEL I BHEL I Grasim I HDFC I ITC I Reliance Inds I Tata Tele I Tisco I BSE Sensex I Nifty I CNX-IT I Dow Jones I Nasdaq I FTSE I Top I Close window I Print page
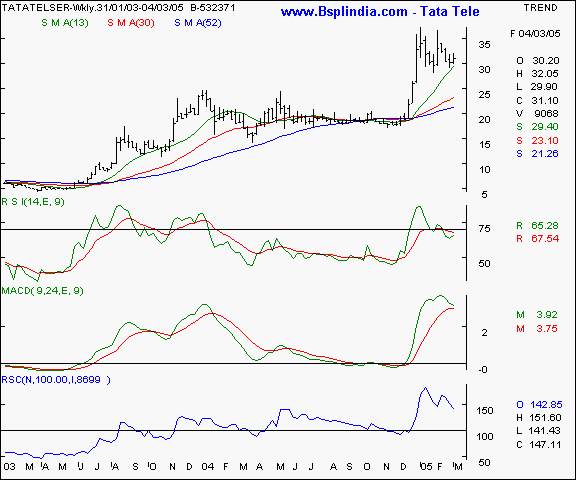
Tata Teleservices - This scrip was recommended by us since it was quoting at half of it's current prices and has been a star of our portfolio recommendations. Earlier reco dates were Dec 05 & 19 2004 and Feb 06 2005. Click here to view the previous recommendations. We feel the current consolidation move is a healthy process in the chart formation which is bullish as the accumulation is in progress. A high relative strength of 143 is inspiring confidence and any breakout above the 34 will see a sharp upmove in the counter. We recommend a buy on the counter.
Your call of action -
-
Investors / cash segment players - Buy at the current levels and keep room for averaging upto the 28 levels. Hold the positions with a stop loss at the 25 mark and expect to book profits at the 45 - 50 levels in the medium / long term.
-
Aggressive F&O traders - f&o n/a.
-
Derivatives contract size - f&o n/a.
Arvind Mills I Bajaj Auto I BEL I BHEL I Grasim I HDFC I ITC I Reliance Inds I Tata Tele I Tisco I BSE Sensex I Nifty I CNX-IT I Dow Jones I Nasdaq I FTSE I Top I Close window I Print page
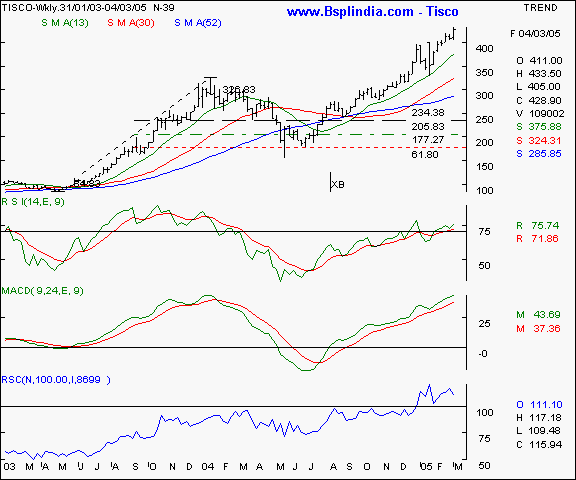
Tisco - this scrip has been another market mover which was recommended by us vide earlier editions dtd Sept 19 & 26 2004, Oct 03, 10 & 23 2004, Nov 07 & 14 2004, Dec 05 & 19 2004, Jan 22 & 30 2005 and Feb 20 & 27 2005. Click here to view the previous recommendations. The stock has been in a bullish groove and is in the progressive phase of a strong chart formation where the upmove is likely to reward even fresh entry on the long side. Technical traders may note the higher tops and bottoms formations and the oscillators in a buy mode, the relative strength climbing to 111 levels and the scrip entering a zero resistance zone. We recommend a buy on this counter for the patient and disciplined investor / trader.
Your call of action -
-
Investors / cash segment players - Buy the scrip at current levels and keep room for averaging till the 400 levels. Maintain a liberal stop loss at the 385 levels and expect to book profits at the 475 levels in the short / medium term and 500 + levels over the next quarter in a conducive market.
-
Aggressive F&O traders - Buy the April futures ( quoting at Rs 5 premium to cash ) at the 432 - 434 levels and hold with a stop loss at the 417 levels. Expect to book profits at the 465 levels in the short / medium term in a conducive market. By the expiry of the April futures, we expect significantly higher levels. Income conscious players can sell the March 400 puts at a suggested premium of Rs 2.50, options players can buy the March 460 calls at Rs 2.50
-
Derivatives contract size - Market lot = 1350 shares. F&O margin = approx Rs 98,000 (subject to change daily )
Arvind Mills I Bajaj Auto I BEL I BHEL I Grasim I HDFC I ITC I Reliance Inds I Tata Tele I Tisco I BSE Sensex I Nifty I CNX-IT I Dow Jones I Nasdaq I FTSE I Top I Close window I Print page
|
Indices - domestic |
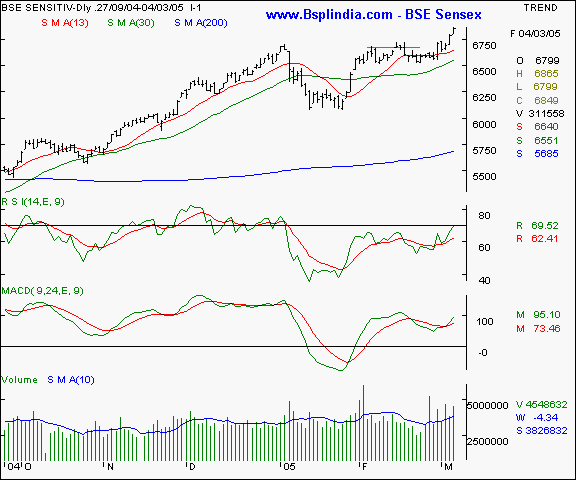
BSE Sensex - this index has signalled a breakout above the all time high of 6720 levels and closed conclusively above that mark. The immediate support area will be at the 6765 levels and a possible target of 6960 in the coming week. The bias is towards bullishness.
Your call of action - Since the Sensex futures are not very liquid, we suggest trading the Nifty 50 instead.
Arvind Mills I Bajaj Auto I BEL I BHEL I Grasim I HDFC I ITC I Reliance Inds I Tata Tele I Tisco I BSE Sensex I Nifty I CNX-IT I Dow Jones I Nasdaq I FTSE I Top I Close window I Print page
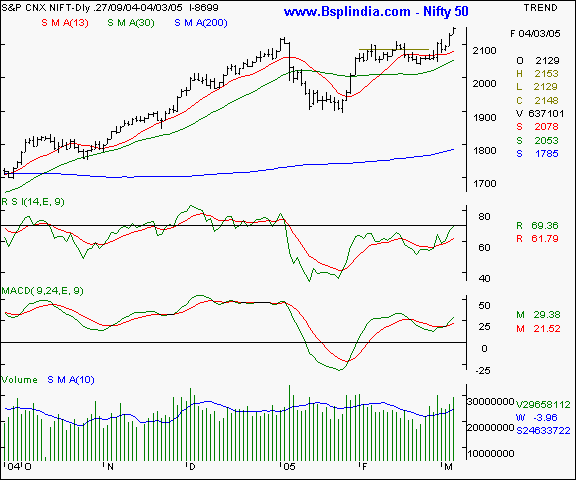
Nifty 50 - The Nifty has exhibited a similar breakout above the previous congestion band which saw a range bound lock on the movement between the 2040 - 2084 levels for 22 trading sessions !!. The 2108 levels will be a significant short term support area and the upside target will be the 2175 - 2185 in the coming week. We maintain a bullish bias and our veteran investors will recollect our January Elliot edition which forecast a 2200 + levels on the Nifty around the budget time. That target is likely to be met / surpassed in the current month.
Your call of action - buy the Nifty March futures at the 2140 - 2145 levels and hold with a stop loss at the 2132 levels. Expect to book profits at the 2165 / 2170 levels. Income conscious players can sell the March 2020 puts at a suggested premium of Rs 8. Options players can buy the March 2160 calls at a premium of Rs 28 - 30 in minimal lots.
Arvind Mills I Bajaj Auto I BEL I BHEL I Grasim I HDFC I ITC I Reliance Inds I Tata Tele I Tisco I BSE Sensex I Nifty I CNX-IT I Dow Jones I Nasdaq I FTSE I Top I Close window I Print page
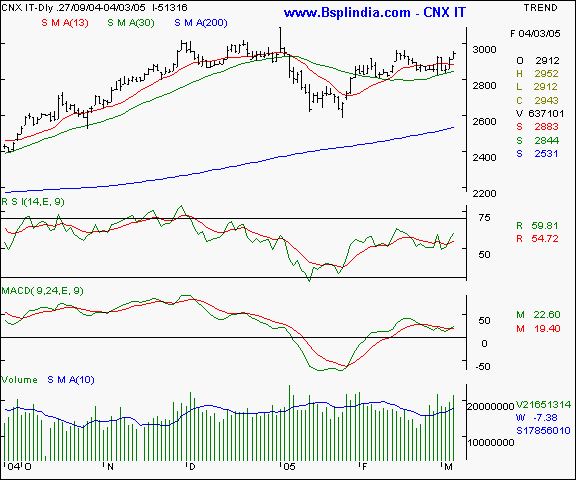
CNX IT - this index has started showing signs of turning around after a 3 month correction phase and close above the 2980 levels will be a conclusive sign of bullishness on the counter. Support exists at the 2880 & 2850 levels and the bias is towards bullishness.
Your call of action - Since the Sensex futures are not very liquid, we suggest trading the Nifty 50 instead.
Arvind Mills I Bajaj Auto I BEL I BHEL I Grasim I HDFC I ITC I Reliance Inds I Tata Tele I Tisco I BSE Sensex I Nifty I CNX-IT I Dow Jones I Nasdaq I FTSE I Top I Close window I Print page
|
Indices - international |
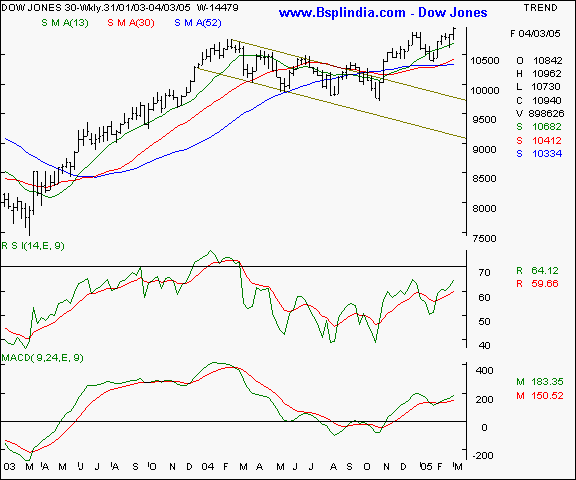
Dow Jones Industrial Average - this NYSE old economy benchmark is trading at it's 3 1/2 year highs and is showing signs of strength as a higher tops and bottoms formation is being signalled. The 13 week SMA is acting as a good support and is currently at the 10685 which is a floor for the medium term. We feel a conclusive and sustained close above the 11000 levels will be a bullish indicators for the global financial markets and will have a trickle down effect on the domestic markets also. The Dow has the potential to scale to the 11,200 levels in the coming fortnight.
Your call of action - Since Indian investors are not allowed to trade in overseas markets, this is a pure academic study.
Arvind Mills I Bajaj Auto I BEL I BHEL I Grasim I HDFC I ITC I Reliance Inds I Tata Tele I Tisco I BSE Sensex I Nifty I CNX-IT I Dow Jones I Nasdaq I FTSE I Top I Close window I Print page
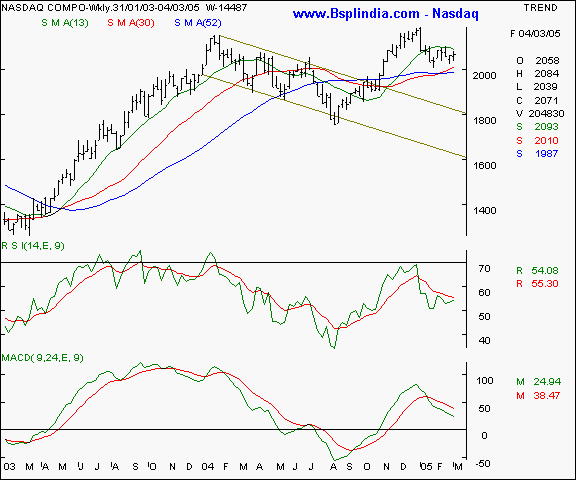
Nasdaq - the Nasdaq is underperforming the Dow Jones and is likely to face resistance at the 2115 levels and support at the 2010 - 2020 levels. Unless a breakout / breakdown is signalled, we do not foresee a clarity in trend in the Nasdaq. The short term outlook is biased towards an upmove.
Your call of action - Since Indian investors are not allowed to trade in overseas markets, this is a pure academic study.
Arvind Mills I Bajaj Auto I BEL I BHEL I Grasim I HDFC I ITC I Reliance Inds I Tata Tele I Tisco I BSE Sensex I Nifty I CNX-IT I Dow Jones I Nasdaq I FTSE I Top I Close window I Print page
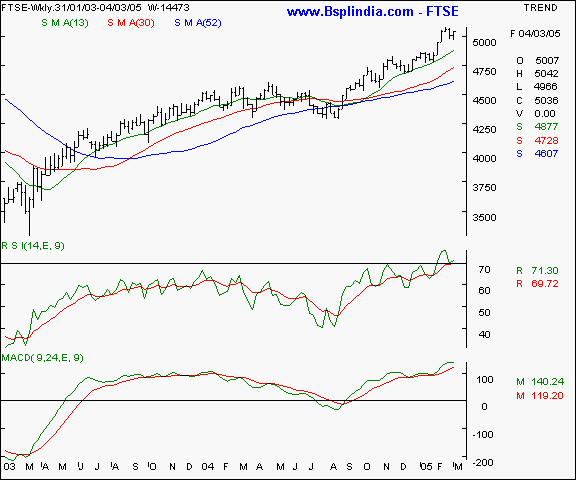
FTSE - This UK index is showing a secular upmove as the index is trading marginally higher than it's psychological resistance at the 5000 levels. The 4915 levels are the floor for the coming week and resistance is likely at the 5140 in the week ahead.
Your call of action - Since Indian investors are not allowed to trade in overseas markets, this is a pure academic study.
Arvind Mills I Bajaj Auto I BEL I BHEL I Grasim I HDFC I ITC I Reliance Inds I Tata Tele I Tisco I BSE Sensex I Nifty I CNX-IT I Dow Jones I Nasdaq I FTSE I Top I Close window I Print page
|
Trading tips for the week |
-
The put / call ratio is climbing and is currently at the 0.36 : 1 levels and the outstanding positions in the derivatives segment have shown a healthy rise. The FII investments are continuing steadily.
-
There is buying at lower levels in stock futures. That indicates a bullish approach as long positions in individual stocks is being hedged by Nifty shorts.
-
The current week is crucial for the markets as there is an immediate demand for cash in the form of advance tax and service tax in the coming weeks. The markets need to show continued strength to discount these factors.
-
The index heavy-weights are showing strength again. This in turn will boost the indices and cause a feel good factor. The only worry is that this upbeat sentiment should continue.
-
Trades must be executed in small volumes due to the higher volatility expected. Trade fewer counters and conserve cash for future opportunities. Try to take bigger moves rather than trade on small margins.
-
Standby for fresh recommendations via SMS on a real - time basis.
- Have a profitable week.
- Vijay L Bhambwani
- Ceo :- Bsplindia.com
The author is a Mumbai based investment consultant and invites feedback at Vijay@BSPLindia.com and ( 022 ) 23438482 / 23400345.
SEBI disclosure :- The author has no positions in any securities mentioned above.
- While all due care has been taken while in compiling the data enclosed herein, we cannot be held responsible for errors, if any, creeping in. Please consult an independent qualified investment advisor before taking investment decisions. This mail is not sent unsolicited, and only advisory in nature. We have accepted no consideration from any company mentioned above and recommend taking decisions on merits of the stocks from our viewpoint. This email is being sent to you as a paid subscriber. Please protect your interests and ours by not disclosing the contents to any un-authorised person/s
Legal notice :- The Professional Ticker Reader is a trademark of Bhambwani Securities (P) Ltd. and any un-authorised replication / duplication in part or full will be infringing our trademark and will result in legal action being enforced on the infringing persons / parties.
