- Your accurate, authentic and affordable guide to investing
Flavours of the week Mar 20, 2005
These are stocks that we expect to out-perform the markets. Cash and derivative strategies are advised thereon. Please stay online to enable loading of graphics from our servers. Please also read the trading tips section at the end of the newsletter.
|
Individual stocks. |
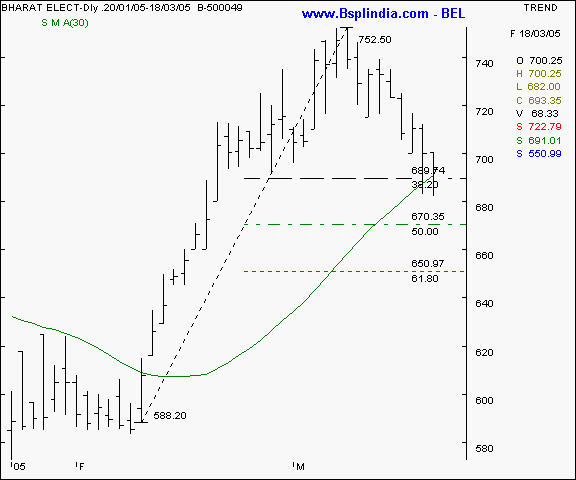
Bharat Electronics - this PSU major was recommended as a buy recently but has corrected sharply in the recent times. The attempt in the chart below is to guage the extent of the fall that is likely in the coming days. The scrip has already tested the 38.2 % retracement at the 689 levels and closed above it. Logically, the next support is at the 670 mark and that is the 50 % retracement of the entire upmove. The 50 % retracement is a very significant support in fibonnaci series and this threshold level must be watched in the coming days very keenly. If the 690 levels hold and the scrip rallies, the next top will be above 750 in the short to medium term. In case the 690 levels are violated, expect support at 670. Traded volumes on the upsides must be watched carefully to judge the sustainability of the upmove.
Your call of action -
-
Investors / cash segment players - buy the scrip in small lots on all declines and average lower in a pyramid fashion upto the 665 - 670 levels. Maintain a stop loss at the 650 mark. Expect to book profits at the 725 - 750 levels in a rising market in the medium term.
-
Aggressive F&O traders - Buy the April futures at lower levels between 690 - 695 and hold with a liberal stop loss at the 665. Expect to book profits at the 725 - 745 in a conducive market in the medium term.
-
Derivatives contract size - Market lot = 550 shares. F&O margin = approx Rs 68,000 (subject to change daily )
BEL I BHEL I HCL Tech I HDFC Bank I Hind Lever I Satyam Computers I TCS I Telco I BSE Sensex I Nifty I CNX-IT I Dow Jones I Nasdaq I FTSE I Top I Close window I Print page
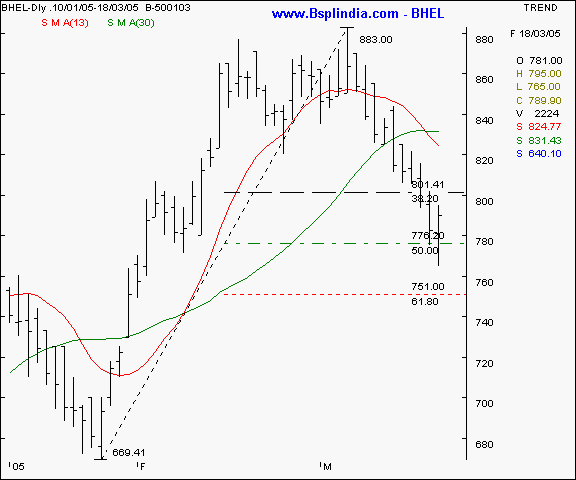
BHEL - This is another recommendation from us that has under-performed and corrected sharply. A retracement study shows that the scrip has tested the 50 % levels at the 775 mark, but managed to close above it. A major support at the 750 levels ( 68.20 % retracement ) exists, which needs to be watched during the coming week. Buying at lower levels with a view to exit at the short term moving average levels would be a medium risk strategy.
Your call of action -
-
Investors / cash segment players - Buy at lower levels of 760 - 770 and hold with a liberal stop loss at the 720 mark. Expect to book profits at the 830 - 850 mark in a conducive market in the medium term time frame.
-
Aggressive F&O traders - Buy the April futures at the 785 - 790 levels and hold with a stop loss at the 774 levels. Expect to book profits at the 820 levels in a conducive market in the medium term.
-
Derivatives contract size - Market lot = 600 shares. F&O margin = approx Rs 85,000 (subject to change daily )
BEL I BHEL I HCL Tech I HDFC Bank I Hind Lever I Satyam Computers I TCS I Telco I BSE Sensex I Nifty I CNX-IT I Dow Jones I Nasdaq I FTSE I Top I Close window I Print page
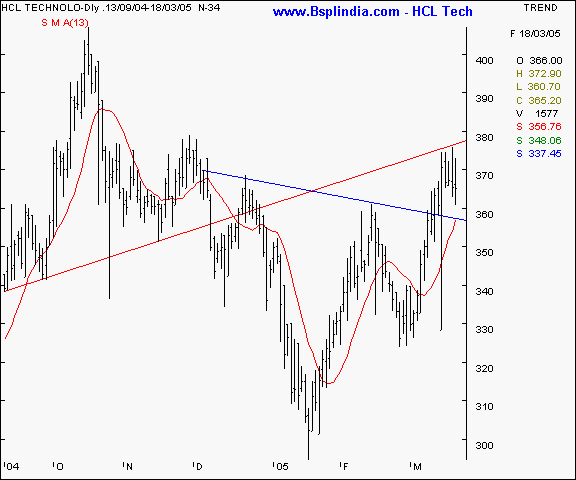
HCL Tech - This scrip shows an interesting chart pattern which is indicative of the sharp volatility that is currently witnessed on the immediate outlook for the scrip. The red trendline indicates a head & shoulder pattern which was forecast by us vide our newsletter in Dec 2004. Being a measuring move, it is possible to predict the price targets in such patterns. Once the bearish head and shoulder was completed, a bullish one has been confirmed by the blue trendline. This is an inverted head and shoulder pattern and a confirmation was achieved once the scrip closed above the 356 levels consistently. Should the scrip manage to trade above 377 - 380 with higher volumes and overall firm sentiments, we feel the 400 mark is achievable in the coming few weeks.
Your call of action -
-
Investors / cash segment players - buy on declines to the 350 - 355 levels and maintain a stop loss at the 338 levels. Expect to book profits at the 380 levels partially and 400 + levels completely in the medium term.
-
Aggressive F&O traders - Buy the April futures once a conclusive close above the 380 mark is achieved in spot. Hold with a stop loss of Rs 6 - 8 and expect to book profits at the 395 - 398 levels in a conducive market in the short / medium term.
-
Derivatives contract size - Market lot = 1300 shares. F&O margin = approx Rs 79,000 (subject to change daily )
BEL I BHEL I HCL Tech I HDFC Bank I Hind Lever I Satyam Computers I TCS I Telco I BSE Sensex I Nifty I CNX-IT I Dow Jones I Nasdaq I FTSE I Top I Close window I Print page
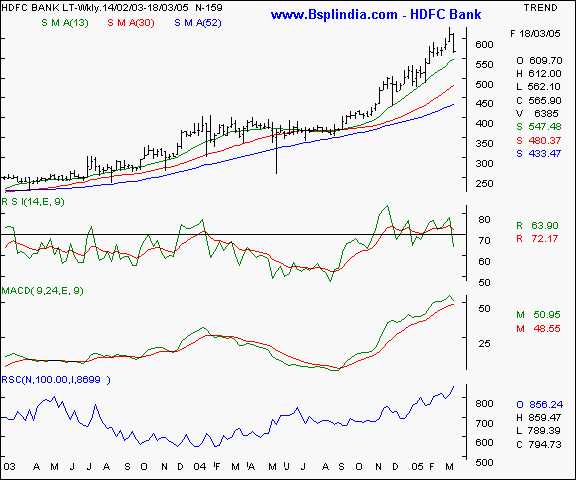
HDFC Bank - this high relative strength scrip was recommended by us since it quoted at near the 400 mark and has been on of our star performers. Technical traders will note the very high relative strength of 856 ( where 100 = base ) and a bullish chart pattern where consistent higher tops and bottoms formations are seen. The 13 week SMA has been a historical support for the counter and we suggest buying at these levels for the patient investor / trader, in case the scrip corrects further.
Your call of action -
-
Investors / cash segment players - buy at the 550 - 560 levels in small lots and average lower in pyramid fashion till the 515 mark. Hold with a stop loss at the 500 levels and expect to book profits at the 625 - 650 levels by the year end in a firm market scenario.
-
Aggressive F&O traders - Buy the April futures on declines to the 555 - 558 levels and hold with a stop loss at the 540 mark. Expect to book profits at the 580 - 590 in the short / medium term in a good market.
-
Derivatives contract size - Market lot = 800 shares. F&O margin = approx Rs 78,000 (subject to change daily )
BEL I BHEL I HCL Tech I HDFC Bank I Hind Lever I Satyam Computers I TCS I Telco I BSE Sensex I Nifty I CNX-IT I Dow Jones I Nasdaq I FTSE I Top I Close window I Print page
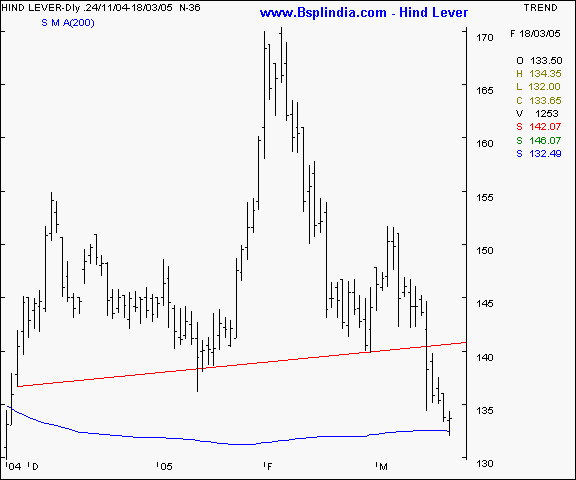
Hind Lever - this stock has been often advocated by us a bearish candidate and our veteran subscribers will recollect that we had consistently advocated a successful income based strategy on this scrip in the f&o segment. The chart pattern below will explain our renewed interest on this scrip to technical traders. The rough and ready head and shoulders pattern formed shows a bearish outlook on the counter. A consistent close below the 140 mark has been a confirmation of that bearishness. The distance between the neckline and the head indicates a measuring move that is likely to see the scrip plunging to the 110 - 115 mark over a period of time. Also noteworthy is the fact that the scrip is currently poised on it's 200 day SMA average.
Your call of action -
-
Investors / cash segment players - n/a.
-
Aggressive F&O traders - Short the February futures on all major advances at / above the 137 levels and hold with a stop loss at the 142 levels. Expect to book profits at the 130 / 125 levels in a conducive market in the short / medium term. Options players can buy the March 130 puts at a suggested premium of Re 1. Income conscious players may sell the March 145 calls at Re 1 premium.
-
Derivatives contract size - Market lot = 2,000 shares. F&O margin = approx Rs 49,000 (subject to change daily )
BEL I BHEL I HCL Tech I HDFC Bank I Hind Lever I Satyam Computers I TCS I Telco I BSE Sensex I Nifty I CNX-IT I Dow Jones I Nasdaq I FTSE I Top I Close window I Print page
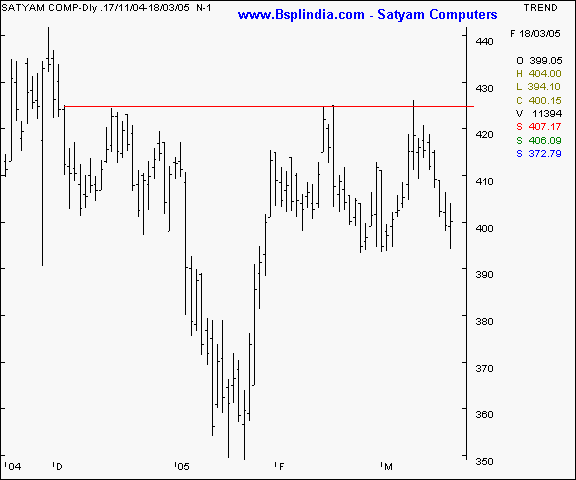
Satyam Computers - this volatile traders favourite enjoys a high beta reading that makes it a high risk high return players delight. Currently, the scrip is unable to surpass the 425 levels which is proving to be a 3 month triple top. The 392 levels are a significant support area in this chart formation and we feel every income conscious player can exploit this opportunity of writing deeply out of money calls and benefiting from the premium.
Your call of action - .
-
Investors / cash segment players - n/a.
-
Aggressive F&O traders - sell the March 430 calls at a suggested price of Rs 1.50
-
Derivatives contract size - Market lot = 1200 shares. F&O margin = approx Rs 84,000 (subject to change daily )
BEL I BHEL I HCL Tech I HDFC Bank I Hind Lever I Satyam Computers I TCS I Telco I BSE Sensex I Nifty I CNX-IT I Dow Jones I Nasdaq I FTSE I Top I Close window I Print page
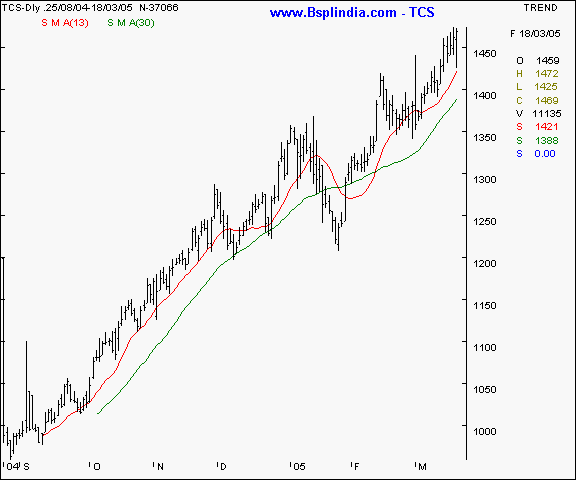
TCS - this technology bell weather has been recommended by us a strong buy on many an occasion and the scrip has paid off rich profits to all bulls. Currently at it's all time high, the price projection of 1540 - 1550 ( advocated by us via SMS last week ) holds good. Note the constant rising tops and bottoms formation and the constant historical support at the 30 day SMA. We recommend a buy for the patient and disciplined investor / trader.
Your call of action -
-
Investors / cash segment players - buy the scrip on all declines with a view to averaging downwards in a pyramid formation till the 1400 levels. Maintain a stop loss at the 1365 mark and expect to book profits at the 1500 + levels in the medium term. Longer term players may expect higher levels.
-
Aggressive F&O traders - buy the April futures at the 1470 levels and hold with a stop loss at the 1440 levels. Expect to book profits at the 1528 - 1540 levels in the short / medium term in a conducive market.
-
Derivatives contract size - Market lot = 250 shares. F&O margin = approx Rs 56,000 (subject to change daily )
BEL I BHEL I HCL Tech I HDFC Bank I Hind Lever I Satyam Computers I TCS I Telco I BSE Sensex I Nifty I CNX-IT I Dow Jones I Nasdaq I FTSE I Top I Close window I Print page
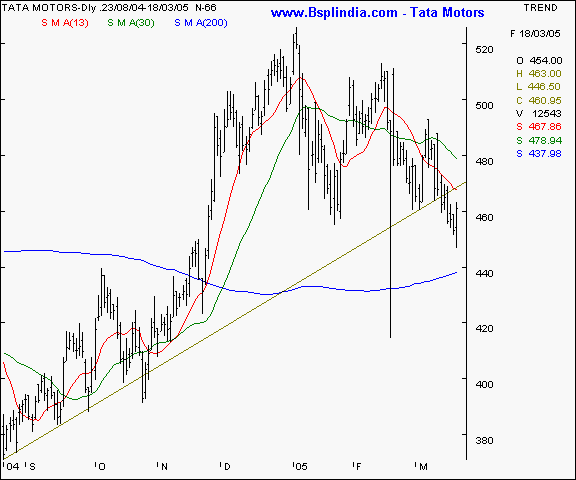
Tata Motors - this scrip was recommended as a short sell in the previous week's edition and has been a successful trade. The fall below the bullish trendline ( 468 levels ) has been an indicator of weakness even as the moving averages have signalled a sell earlier. We feel a fall below the 440 levels will cause a sharper fall to the 425 levels in case the sentiments dive lower. We recommend sell on the counter.
Your call of action -
-
Investors / cash segment players - n/a.
-
Aggressive F&O traders - Short sell the March futures at the 462 - 466 levels and hold with a stop loss at the 471 levels. Expect to book profits at the 445 - 448 levels in a conducive market scenario in the short / medium term. Options players can buy the March 450 puts at a premium of Rs 5. Income conscious players can sell the March 490 calls at Rs 2.50.
-
Derivatives contract size - Market lot = 825 shares. F&O margin = approx Rs 65,000 (subject to change daily )
BEL I BHEL I HCL Tech I HDFC Bank I Hind Lever I Satyam Computers I TCS I Telco I BSE Sensex I Nifty I CNX-IT I Dow Jones I Nasdaq I FTSE I Top I Close window I Print page
|
Indices - domestic |
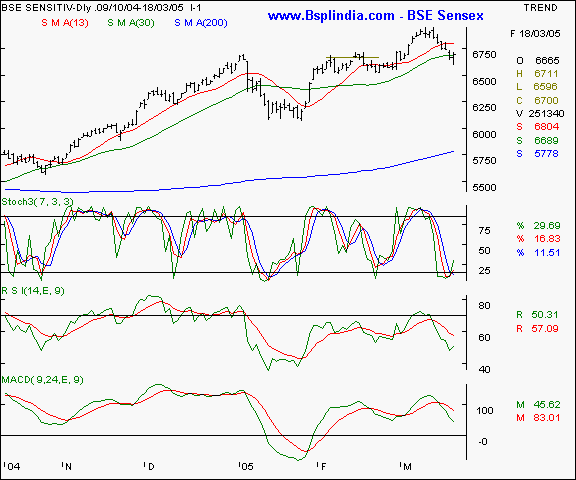
BSE Sensex - The daily bar chart of the Sensex shows a bounceback from the 6596 levels which is very close to the February resistance levels as the markets were rangebound in Feb 2005. The oscillators show an oversold level and a possible upmove is not ruled out. The upsides are likely to see 6760 - 6800 levels where resistance will be higher. The downsides are likely to be restricted to the 6550 levels in the immediate future
Your call of action - Since the Sensex futures are not very liquid, we suggest trading the Nifty 50 instead.
BEL I BHEL I HCL Tech I HDFC Bank I Hind Lever I Satyam Computers I TCS I Telco I BSE Sensex I Nifty I CNX-IT I Dow Jones I Nasdaq I FTSE I Top I Close window I Print page
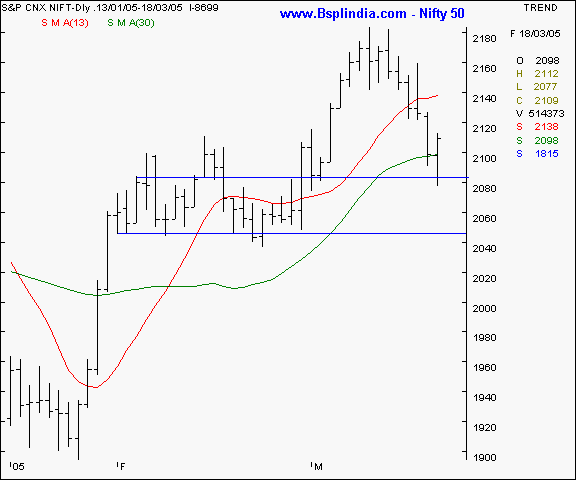
Nifty 50 - The Nifty too shows a bounceback from near the Feb 2005 congestion levels of 2080 - 2085 band. That is the short term floor for the Nifty and the 2050 as a strong support in the medium term. Upsides will see selling pressure mount at the 2130 - 2145 levels. Only of the Nifty spot surpasses these levels convincingly, will the upmove commence.
Your call of action - Buy the Nifty April futures at lower levels of 2080 - 2090 and hold with a stop loss at the 2066 mark. Income conscious players may sell the March 2190 calls at a suggested premium of Rs 5.
BEL I BHEL I HCL Tech I HDFC Bank I Hind Lever I Satyam Computers I TCS I Telco I BSE Sensex I Nifty I CNX-IT I Dow Jones I Nasdaq I FTSE I Top I Close window I Print page
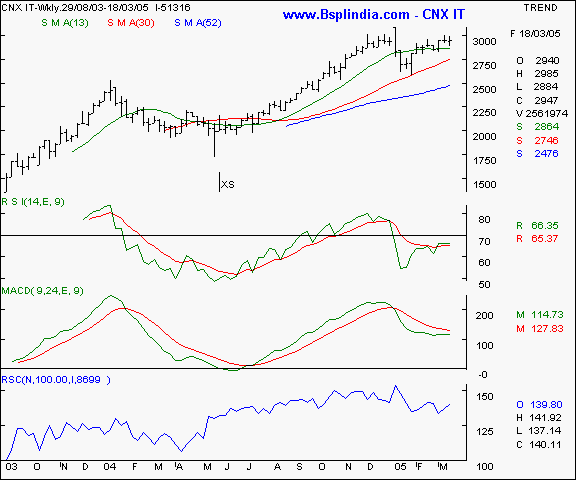
CNX IT - this technology index has outperformed the broader indices and is showing higher relative strength. The 2878 levels are a crucial support and the 3045 is a short term resistance.
Your call of action - Since the CNX IT futures are not very liquid, we suggest trading the Nifty 50 instead.
BEL I BHEL I HCL Tech I HDFC Bank I Hind Lever I Satyam Computers I TCS I Telco I BSE Sensex I Nifty I CNX-IT I Dow Jones I Nasdaq I FTSE I Top I Close window I Print page
|
Indices - international |
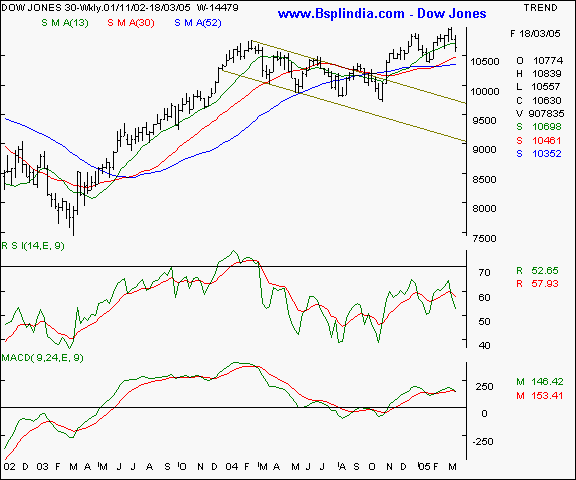
Dow Jones Industrial Average - this NYSE index has plunged after hitting a 3 1/2 year high. The 10480 levels will be a short term support and the 10745 a short term resistance.
Your call of action - Since Indian investors are not allowed to trade freely in overseas markets, this is a pure academic study.
BEL I BHEL I HCL Tech I HDFC Bank I Hind Lever I Satyam Computers I TCS I Telco I BSE Sensex I Nifty I CNX-IT I Dow Jones I Nasdaq I FTSE I Top I Close window I Print page
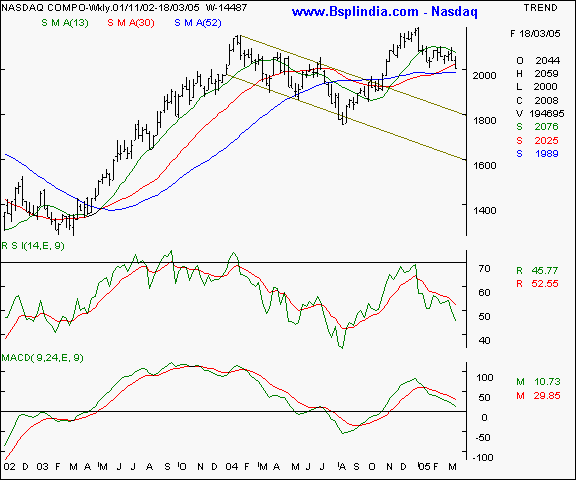
Nasdaq - this technology index has shown a similar chart pattern as the NYSE and is likely to test the 1980 levels in a weak market scenario and upsides be limited to the 2060 levels.
Your call of action - Since Indian investors are not allowed to trade freely in overseas markets, this is a pure academic study.
BEL I BHEL I HCL Tech I HDFC Bank I Hind Lever I Satyam Computers I TCS I Telco I BSE Sensex I Nifty I CNX-IT I Dow Jones I Nasdaq I FTSE I Top I Close window I Print page
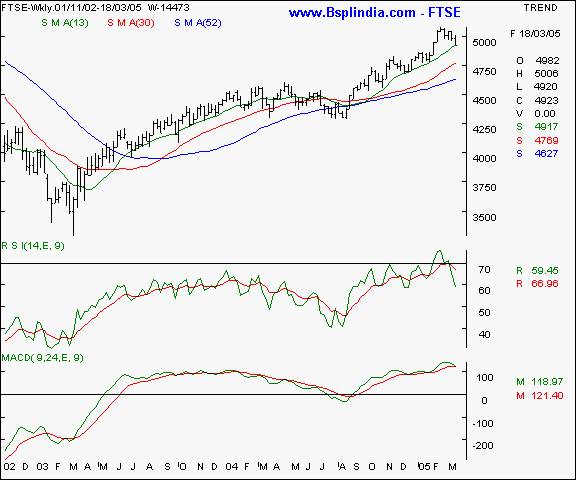
FTSE - this UK index has shown a higher relative strength as compared to the US markets and is likely to correct lower to the 4830 - 4850. Upsides will be capped at the 5080 in the coming week
Your call of action - Since Indian investors are not allowed to trade freely in overseas markets, this is a pure academic study.
BEL I BHEL I HCL Tech I HDFC Bank I Hind Lever I Satyam Computers I TCS I Telco I BSE Sensex I Nifty I CNX-IT I Dow Jones I Nasdaq I FTSE I Top I Close window I Print page
|
Trading tips for the week |
-
The put / call ratio is steady and is currently at the 0.39 : 1 levels and the outstanding positions in the derivatives segment have shown rise on a week-on-week. The FII investments are continuing albeit down to a trickle.
-
There is offloading at higher levels in stock futures. That indicates a cautious approach as long positions in individual stocks is being hedged by Nifty shorts.
-
The impeding expiry of the February series will see offloading and higher volatility in the near term.
-
Trades must be executed in small volumes due to the higher volatility expected. Trade fewer counters and conserve cash for future opportunities.
-
Standby for fresh recommendations via SMS on a real - time basis.
- Have a profitable week.
- Vijay L Bhambwani
- Ceo :- Bsplindia.com
The author is a Mumbai based investment consultant and invites feedback at Vijay@BSPLindia.com and ( 022 ) 23438482 / 23400345.
SEBI disclosure :- The author has no positions in any securities mentioned above.
- While all due care has been taken while in compiling the data enclosed herein, we cannot be held responsible for errors, if any, creeping in. Please consult an independent qualified investment advisor before taking investment decisions. This mail is not sent unsolicited, and only advisory in nature. We have accepted no consideration from any company mentioned above and recommend taking decisions on merits of the stocks from our viewpoint. This email is being sent to you as a paid subscriber. Please protect your interests and ours by not disclosing the contents to any un-authorised person/s
Legal notice :- The Professional Ticker Reader is a trademark of Bhambwani Securities (P) Ltd. and any un-authorised replication / duplication in part or full will be infringing our trademark and will result in legal action being enforced on the infringing persons / parties.
