- Your accurate, authentic and affordable guide to investing
Flavours of the week Mar 26, 2005
These are stocks that we expect to out-perform the markets. Cash and derivative strategies are advised thereon. Please stay online to enable loading of graphics from our servers. Please also read the trading tips section at the end of the newsletter.
|
Individual stocks |
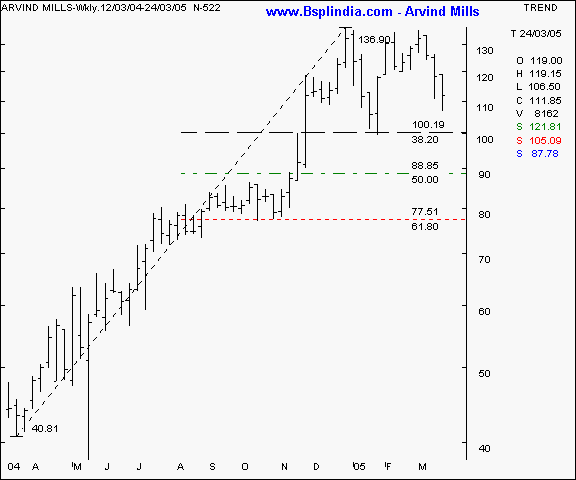
Arvind Mills - this textile major was advocated as hitting a resistance zone at 140 - 141 which is a formidable wave count resistance. The 101 - 105 region is a support as per retracement studies. The retracement pattern given below shows a reasonably good support at the 100 mark which was a significant high point of Nov ' 04 and significant low of January ' 05. As long as this level holds, patient traders and medium / long term investors can attempt bottom fishing in small lots.
Your call of action -
-
Investors / cash segment players - buy on declines to the 100 levels and hold with a stop loss at the 89 levels. Expect to book profits at the 116 - 119 levels in a conducive market in the medium term, as long as the 88 levels are not violated on a closing basis.
-
Aggressive F&O traders - Buy the April futures on declines to the 104 levels and hold with a stop loss at the 99 levels. Expect to book profits at the 109 / 111 levels in the near / medium term in a conducive market. Income conscious players may sell the April 130 calls at a suggested price of Rs 2 and above.
-
Derivatives contract size - Market lot = 4300 shares. F&O margin = approx Rs 81,000 (subject to change daily )
Arvind Mills I Andhra Bank I BEL I HDFC I HDFC Bank I Hind Lever I HPCL I ITC I Reliance I SBI I Telco I Tata Power I UBI I BSE Sensex I Nifty I CNX-IT I Dow Jones I Nasdaq I FTSE I Top I Close window I Print page
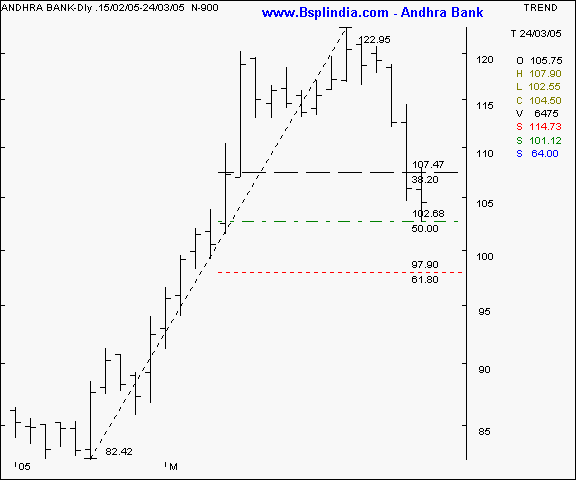
Andhra Bank - this scrip was advocated as a weak component of the banking pack ever since it fell below the 112 levels. That support broken, the scrip has nosedived a further 9 % and tested it's 50 % retracement levels. We feel a 102 support is an important benchmark to watch out for. Should this level hold, expect a possible rally to the 110 - 112 levels where long positions can be pared and shorts positions initiated. This is a trade recommendation for the high risk aggressive players only.
Your call of action -
-
Investors / cash segment players - start profit taking at the 112 - 115 levels and exit from the counter completely at the 120 levels.
-
Aggressive F&O traders - start initiating long positions in April futures as long as the 102 levels are not violated and book profits on every Rs 2 upmove. Keeping this trading strategy in mind, maintain a stop loss at 103 ( April futures ) and exit completely at the 108 - 110 levels. Once the April futures start trading above 111 - 112, start initiating short positions in minimum lots with a stop loss at the 115.50 and a target price of 106 - 108. Income players can sell the April 125 calls at a suggested price of Rs 2 and above.
-
Derivatives contract size - Market lot = 4600 shares. F&O margin = approx Rs 1,20,000 (subject to change daily )
Arvind Mills I Andhra Bank I BEL I HDFC I HDFC Bank I Hind Lever I HPCL I ITC I Reliance I SBI I Telco I Tata Power I UBI I BSE Sensex I Nifty I CNX-IT I Dow Jones I Nasdaq I FTSE I Top I Close window I Print page
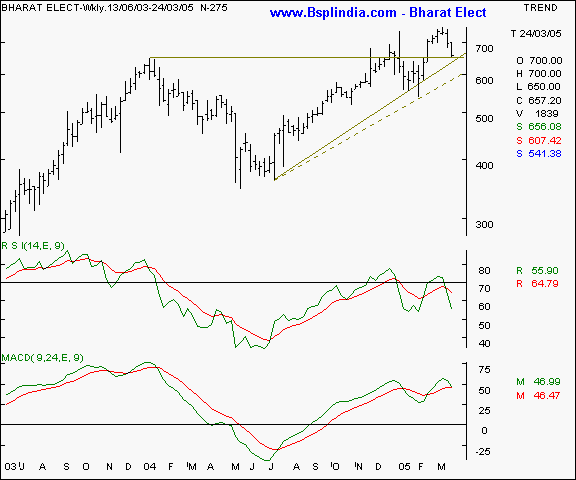
Bharat Elect - this scrip has been declining steadily with the markets and is now on the threshold of a support offered by the upper trendline of an ascending triangle. It maybe noted that the scrip is near it's lifetime highs and therefore likely to see extreme volatility due to selling pressure from skeptical investors. There is a ready support at the 640 levels and should that be violated, expect excellent support from the dashed trendline at the 610 levels in a worst case scenario. Watch the price / volume action for signs of trend determination and initiate long buying at lower levels.
Your call of action -
-
Investors / cash segment players - initiate long purchases below the 640 levels and maintain a stop loss at the 595 levels. Expect to book profits at the 685 partially and 700 levels completely in the medium term. Longer term players are likely to expect even higher levels.
-
Aggressive F&O traders - Buy the May futures at lower levels of 635 - 640 and maintain a stop loss at the 615 levels. Expect to book profits at the 690 - 700 levels in a conducive market in the medium term.
-
Derivatives contract size - Market lot = 550 shares. F&O margin = approx Rs 61,000 (subject to change daily )
Arvind Mills I Andhra Bank I BEL I HDFC I HDFC Bank I Hind Lever I HPCL I ITC I Reliance I SBI I Telco I Tata Power I UBI I BSE Sensex I Nifty I CNX-IT I Dow Jones I Nasdaq I FTSE I Top I Close window I Print page
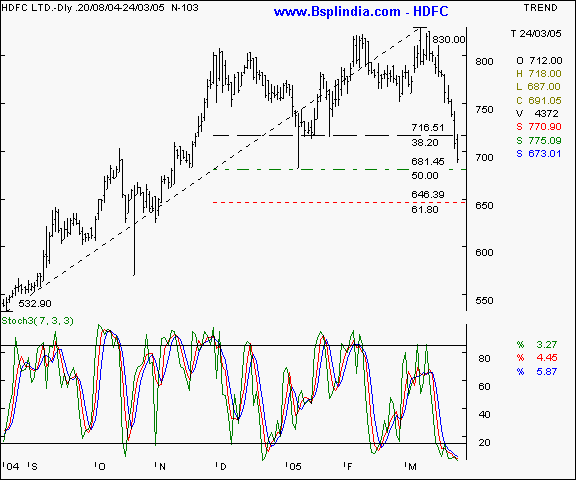
HDFC - this scrip has been under pressure ever since it violated the 715 levels and closed below this threshold level . The retracement pattern suggests support at the 675 - 680 levels and the crucial support being at the 650 levels. It maybe noted that almost all index frontline counters are currently trading in their oversold territories and this scrip is no exception. Note how the stochastics indicator is in the oversold region and the 200 day SMA is placed at the 673 levels ( not shown in the chart ). We recommend a buy for the patient and disciplined investor with a medium term perspective.
Your call of action -
-
Investors / cash segment players - buy near the 670 levels and leave room for averaging to the 640 levels. Hold with a stop loss at the 625 levels and expect profit taking at the 800 + levels in a few months in a conducive market.
-
Aggressive F&O traders - buy the May futures on major declines to the 680 - 685 levels and hold with a deep stop loss at the 650 levels. Expect to book profits at the 750 levels in the medium term.
-
Derivatives contract size - Market lot = 600 shares. F&O margin = approx Rs 67,000 (subject to change daily )
Arvind Mills I Andhra Bank I BEL I HDFC I HDFC Bank I Hind Lever I HPCL I ITC I Reliance I SBI I Telco I Tata Power I UBI I BSE Sensex I Nifty I CNX-IT I Dow Jones I Nasdaq I FTSE I Top I Close window I Print page
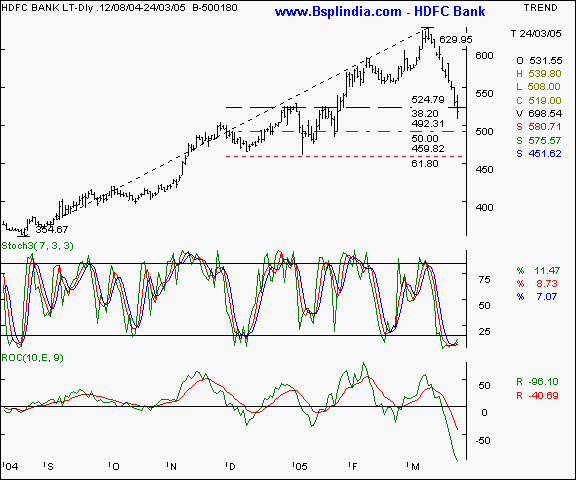
HDFC Bank - this private banking major has been falling in sympathy with the PSU segment and is now trading near the 38 % retracement levels. A level of 490 would be a good entry point for patient players and this level corresponds with the 50 % retracement and an important wave count support where the probability of profits are significantly higher. We recommend a buy for the savvy investor / trader. The oversold reading on the oscillators maybe noted which indicates a limited downside in the short term.
Your call of action -
-
Investors / cash segment players - Buy the scrip near / below the 500 mark and keep room for averaging till the 475 levels and maintain a stop loss at the 450 levels. Expect to book profits at the 570 - 580 levels in a conducive market in the medium term. Longer term investors may expect higher levels.
-
Aggressive F&O traders - Buy the May futures at the 485 - 490 levels and maintain a stop loss at the 472 levels. Expect profit taking at the 540 levels in the short / medium term in a conducive market.
-
Derivatives contract size - Market lot = 800 shares. F&O margin = approx Rs 67,000 (subject to change daily )
Arvind Mills I Andhra Bank I BEL I HDFC I HDFC Bank I Hind Lever I HPCL I ITC I Reliance I SBI I Telco I Tata Power I UBI I BSE Sensex I Nifty I CNX-IT I Dow Jones I Nasdaq I FTSE I Top I Close window I Print page
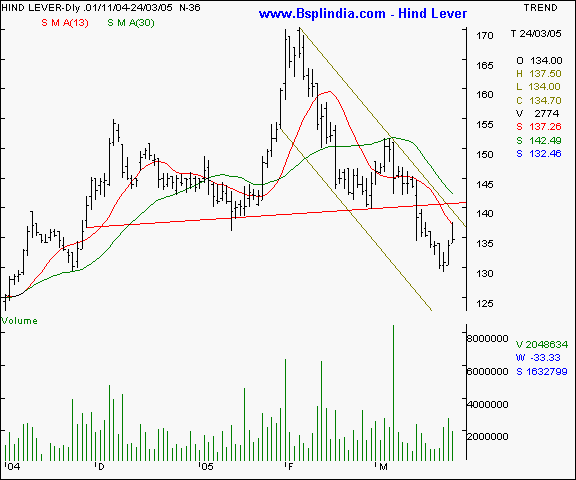
Hind Lever - this scrip was advocated as a short sell candidate ever since it violated the red trendline which marks a head & shoulder pattern. The critical threshold level is the 142 levels which is the neckline and the trend determinator for this counter. We expect a routine pullback upwards to this level after a steep fall witnessed recently. Should the scrip be unable to surpass the 142 levels with higher volumes, it's a signal for bears to go short. Technical traders may also note the bearish channel that the scrip is trading within. The lower tops and bottoms formation is a sign of weakness and the current bounce above the 200 day SMA ( not shown in the graphic ) is not confidence inspiring.
Your call of action -
-
Investors / cash segment players - n/a.
-
Aggressive F&O traders - start shorting the April futures at higher levels of 140 - 141 and hold with a stop loss at the 144.50 levels. Expect to book profits at the 130 levels in a conducive market. Income conscious players may sell the April 145 calls at a suggested premium of Rs 3 - 3.50
-
Derivatives contract size - Market lot = 2000 shares. F&O margin = approx Rs 44,000 (subject to change daily ).
Arvind Mills I Andhra Bank I BEL I HDFC I HDFC Bank I Hind Lever I HPCL I ITC I Reliance I SBI I Telco I Tata Power I UBI I BSE Sensex I Nifty I CNX-IT I Dow Jones I Nasdaq I FTSE I Top I Close window I Print page
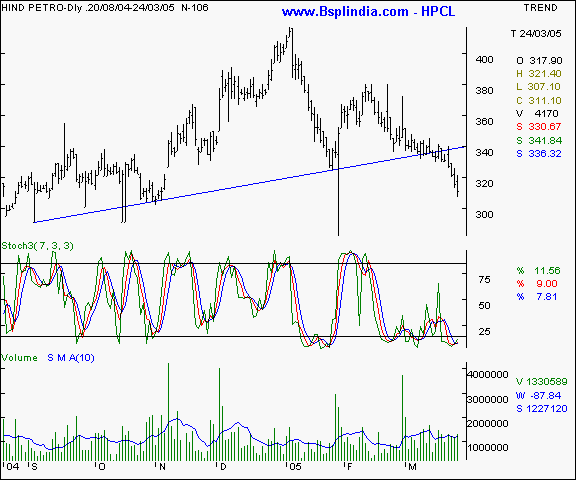
Hind Petro - another scrip with a bearish implication due to a confirmed head and shoulder formation and price / volume action confirming the weakness. The volumes are marked with a 10 day SMA and currently, the scrip is trending lower with higher volumes. There are indications of a distribution in progress and we feel upsides are likely to be met with selling pressure. We feel the head and shoulder formation is pointing towards a 10 - 15 % fall on the counter over the next 2 - 3 quarters in case the oil prices remain firm and all other factors remaining constant. We advocate short selling on advances.
Your call of action -
-
Investors / cash segment players - exit on all major advances.
-
Aggressive F&O traders - Short the April futures in case of a pullback to the 327 - 330 levels and hold with a stop loss at the 338 levels. Expect to book profits at the 305 - 310 levels in the short / medium term. In case of longer term perspective, further weakness is likely.
-
Derivatives contract size - Market lot = 650 shares. F&O margin = approx Rs 35,000 (subject to change daily )
Arvind Mills I Andhra Bank I BEL I HDFC I HDFC Bank I Hind Lever I HPCL I ITC I Reliance I SBI I Telco I Tata Power I UBI I BSE Sensex I Nifty I CNX-IT I Dow Jones I Nasdaq I FTSE I Top I Close window I Print page
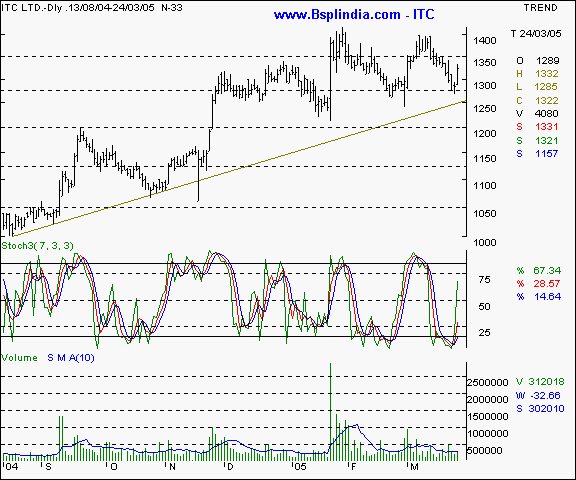
ITC - this FMCG major was recommended by us as a market out-performer and has lived up to our expectations. The upward sloping trendline is providing a reliable support and the higher tops formation is confidence inspiring. To complete a bullish picture, a breakout above the 1400 levels will propel this stock into a new bull orbit with zero resistance on the upsides. Short term traders may note the 1275 levels as being threshold levels for short term sentiments. The 1250 levels lower down offer more serious support for the medium / long term investors. The momentum oscillator is pointing towards an upmove and we feel the rally past 1350 with volumes exceeding 4,00,000 will be an excellent buy indicator for bulls.
Your call of action -
-
Investors / cash segment players - buy the scrip at the current levels and leave room for averaging till the 1280 levels. Maintain a stop loss at the 1250 mark and expect to book profits at the 1375 / 1380 levels in a conducive market in the short / medium term. Longer term prospects are extremely positive, especially after the 1400 levels are surpassed with higher volumes.
-
Aggressive F&O traders - Buy the April futures at the 1300 levels and hold with a stop loss at the 1275 levels. Expect to book profits at the 1355 - 1365 levels in the short / medium term. Longer term outlook remains even higher.
-
Derivatives contract size - Market lot = 300 shares. F&O margin = approx Rs 64,000 (subject to change daily )
Arvind Mills I Andhra Bank I BEL I HDFC I HDFC Bank I Hind Lever I HPCL I ITC I Reliance I SBI I Telco I Tata Power I UBI I BSE Sensex I Nifty I CNX-IT I Dow Jones I Nasdaq I FTSE I Top I Close window I Print page
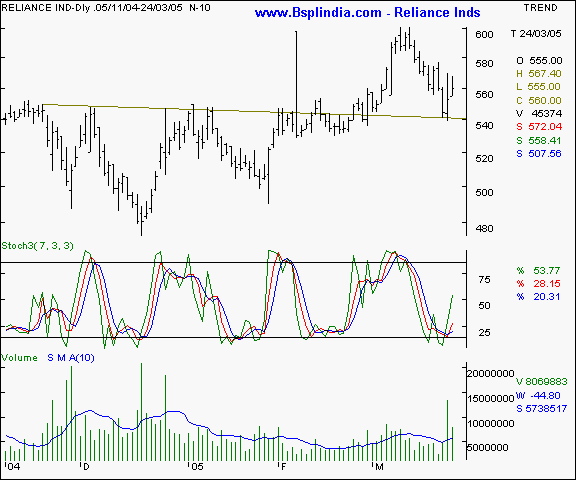
Reliance Inds - this scrip was recommended by us as a strong buy ever since it surpassed the 542 levels with a surge in volumes. That completed an inverted head and shoulder formation and the volumes which rose past the 10 day average confirmed that pattern. The first target price of 600 was comfortably achieved and the scrip is in a consolidation mode as a retracement has been seen. As long as the neckline is not violated, expect the scrip to remain buoyant. The momentum oscillator points towards a slight upmove and we recommend a buy.
Your call of action -
-
Investors / cash segment players - Buy the scrip at lower levels of 545 - 550 and hold with a stop loss at the 535 levels. Expect to book profits at the 575 - 580 levels in the near term in a conducive market.
-
Aggressive F&O traders - Buy the April futures at the 558 - 560 levels and hold with a stop loss at the 550 levels. Expect to book profits at the 572 - 578 levels in the near term in a conducive market. Options players may buy the 600 April calls at Rs 8 premium.
-
Derivatives contract size - Market lot = 600 shares. F&O margin = approx Rs 56,000 (subject to change daily )
Arvind Mills I Andhra Bank I BEL I HDFC I HDFC Bank I Hind Lever I HPCL I ITC I Reliance I SBI I Telco I Tata Power I UBI I BSE Sensex I Nifty I CNX-IT I Dow Jones I Nasdaq I FTSE I Top I Close window I Print page
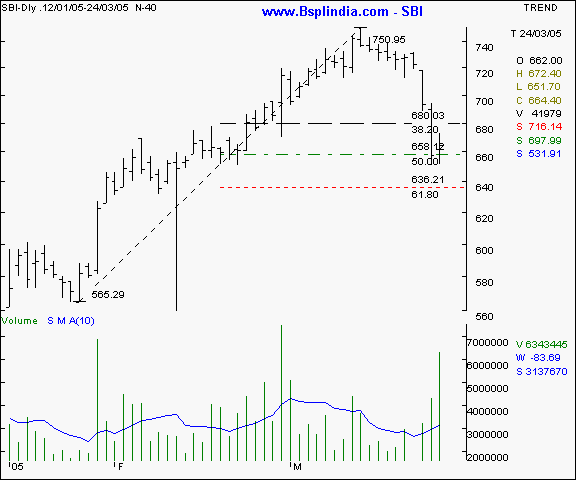
SBI - this PSU banking major has had the dubious distinction of being one of the biggest losers in the previous week and shedding significant open interest as the bulls are baling out in panic. The retracement pattern study indicates a minor / short term support at the 655 levels and a more meaningful support at the 635 levels. The traded volume seem to indicate a sell climax and that the scrip maybe nearing an immediate bottom for now. We recommend a buy for the short term players with a reasonably higher risk appetite.
Your call of action -
-
Investors / cash segment players - Buy the scrip on declines to the 650 levels and leave room for averaging to the 635 - 640 levels.
-
Aggressive F&O traders - Buy the April futures on declines to the 665 - 668 levels and hold with a stop loss at the 658 levels. Expect profit taking at the 680 - 685 levels in a conducive market in the short / medium term. Income conscious players may sell the April 760 calls at a suggested premium of Rs 7 - 8.
-
Derivatives contract size - Market lot = 500 shares. F&O margin = approx Rs 57,000 (subject to change daily )
Arvind Mills I Andhra Bank I BEL I HDFC I HDFC Bank I Hind Lever I HPCL I ITC I Reliance I SBI I Telco I Tata Power I UBI I BSE Sensex I Nifty I CNX-IT I Dow Jones I Nasdaq I FTSE I Top I Close window I Print page
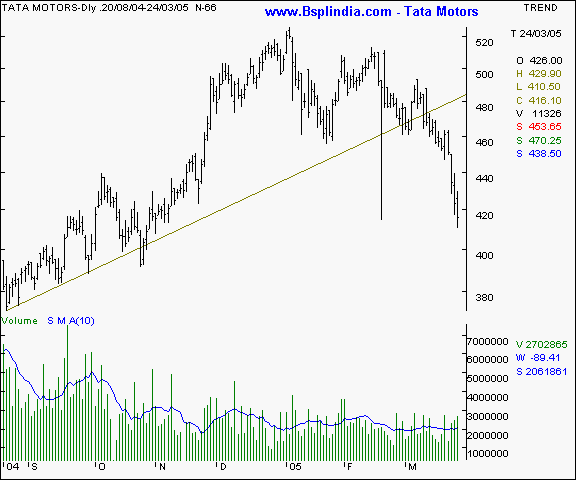
Tata Motors - this scrip has been one of our prolific recommendations for short sales and has rewarded the bears handsomely. After a head and shoulder pattern was confirmed as the 460 levels were violated, we advocated a target of 415 - 422 which was achieved easily. Since the scrip appears poised for a technical pullback, we feel short sales are recommended at higher levels for the higher risk appetite traders.
Your call of action -
-
Investors / cash segment players - n/a.
-
Aggressive F&O traders - Short the April futures on advances to the 434 - 438 levels and hold with a stop loss at the 444 levels. Expect to book profits at the 422 levels in a conducive market in the near term. Income conscious traders may sell the April 480 calls at a suggested premium of Rs. 6.50 - 8 in small / medium lots.
-
Derivatives contract size - Market lot = 825 shares. F&O margin = approx Rs 59,000 (subject to change daily )
Arvind Mills I Andhra Bank I BEL I HDFC I HDFC Bank I Hind Lever I HPCL I ITC I Reliance I SBI I Telco I Tata Power I UBI I BSE Sensex I Nifty I CNX-IT I Dow Jones I Nasdaq I FTSE I Top I Close window I Print page
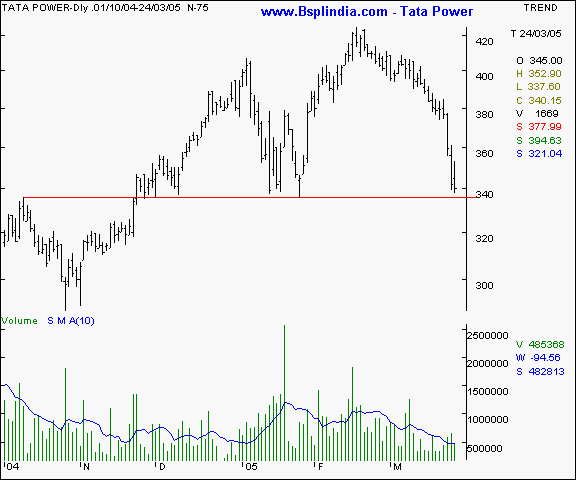
Tata Power - this scrip is exhibiting a weak chart pattern as the stock tests the 335 support for the third time in as many months. The 335 levels are a meaningful levels as the scrip has broken out in November ' 04 from this levels and the erstwhile resistance became a support on the downsides. The consolation is that the fall is accompanied by lower traded volumes and the 10 day average of the daily volumes itself is falling. In case the markets are to rebound, the counter will see a relief rally till the 360 - 365 in the near term. We recommend a speculative buy in the event of a market turnaround.
Your call of action -
-
Investors / cash segment players - buy the scrip at the 335 - 340 levels and hold with a stop loss at the 325 mark. Expect to book profits at the 370 - 375 levels in the short / medium term in a conducive market.
-
Aggressive F&O traders - Buy the April futures at the 338 - 340 levels and hold with a stop loss at the 332 levels. Expect to book profits at the 352 - 355 levels in the near term. Alternately, if the scrip trades consistently below the 335 levels in the cash segment, short the April futures and maintain a tight Rs 6 stop loss. Expect to book profits at the 324 - 325 levels.
-
Derivatives contract size - Market lot = 800 shares. F&O margin = approx Rs 47,000 (subject to change daily )
Arvind Mills I Andhra Bank I BEL I HDFC I HDFC Bank I Hind Lever I HPCL I ITC I Reliance I SBI I Telco I Tata Power I UBI I BSE Sensex I Nifty I CNX-IT I Dow Jones I Nasdaq I FTSE I Top I Close window I Print page
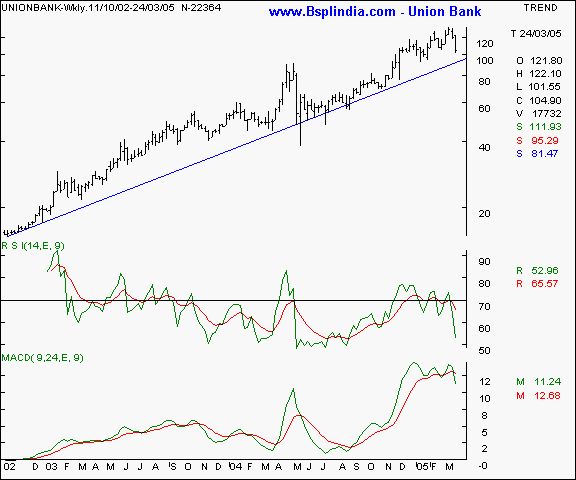
UBI - this PSU banking scrip is likely to derive support at it's 5 month trendline at the 98 levels. The oscillators are pointing towards a weak bias and not yet conclusively negative. A bounceback from the 98 levels or a conclusive fall below it will determine the trend in the immediate future.
Your call of action -
-
Investors / cash segment players - Buy only if the scrip does not break below the 98 levels and the entire market shows signs of revival in the coming days. Maintain a stop loss at the 94 / 95 levels and expect profit taking at the 115 - 117 levels in case of a good pullback.
-
Aggressive F&O traders - Buy the April futures only if the spot does not violate the 98 levels, preferably at the 102 - 103 levels and the broader markets are firm. Maintain a stop loss at the 97 levels and a target of 110 - 112 levels in the near / medium term in a conducive market. Alternately, if the scrip maintains levels below the 97 mark in cash and the markets are looking weak, short sell the April futures and maintain a stop loss at the 102 levels. Expect profit taking at the 92 - 93 levels in the near term.
-
Derivatives contract size - Market lot = 4,200 shares. F&O margin = approx Rs 1,08,000 (subject to change daily )
|
Indices - domestic |
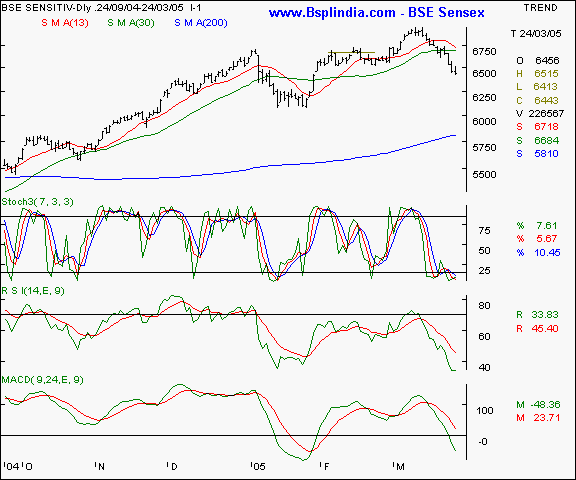
BSE Sensex - The sensex is showing signs of weakness after closing below the 6518 levels and is likely to seek support at the 6250 - 6300 levels in the coming week. An upside of 6620 is the most optimistic target on the upside in the coming week if any reversal occurs. Upsides are likely to be met with selling pressure and we feel the index is likely to remain under pressure in the coming week.
Your call of action - Since the Sensex futures are not very liquid, we suggest trading the Nifty 50 instead.
Arvind Mills I Andhra Bank I BEL I HDFC I HDFC Bank I Hind Lever I HPCL I ITC I Reliance I SBI I Telco I Tata Power I UBI I BSE Sensex I Nifty I CNX-IT I Dow Jones I Nasdaq I FTSE I Top I Close window I Print page
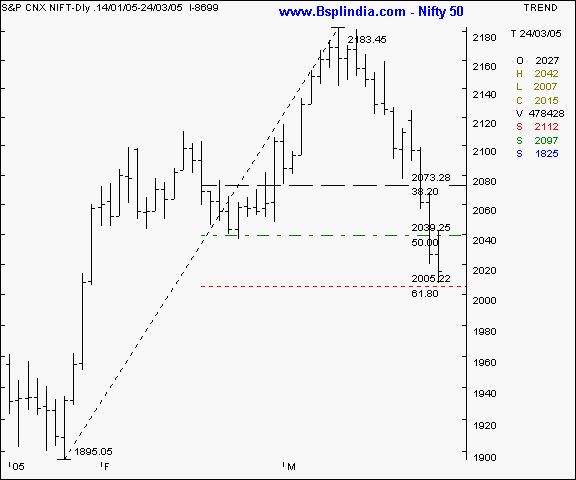
Nifty 50 - The Nifty as we have been advocating, has minor support at the 2004 / 2005 levels and any sustained closing below this level with higher volumes will spell further weakness for the benchmark. Incase of a conclusive violation, expect support at the 1970 - 1960 levels in the coming week. The markets are likely to commence the process of price discovery and is likely to remain in that mode for a few weeks. Upsides will see resistance at the 2040 - 2065 in the coming week. Expect nervous unloading to continue in the coming days.
Your call of action - If the cash does not violate the 2004 levels, buy the April futures and await a pullback on account of short covering due to end of account considerations. Profit target of 2035 / 2040 will be a reasonable target and a stop loss be maintained on all long positions at the 1988 levels in spot. Alternately, if the Nifty falls conclusively below the 1998 levels and stays below, short sell the April futures and hold with a stop loss at the 2016 levels. Expect profit taking at the 1975 in the short term in a conducive market. Income conscious players may sell the April 2200 calls at a suggested premium of Rs. 10
Arvind Mills I Andhra Bank I BEL I HDFC I HDFC Bank I Hind Lever I HPCL I ITC I Reliance I SBI I Telco I Tata Power I UBI I BSE Sensex I Nifty I CNX-IT I Dow Jones I Nasdaq I FTSE I Top I Close window I Print page
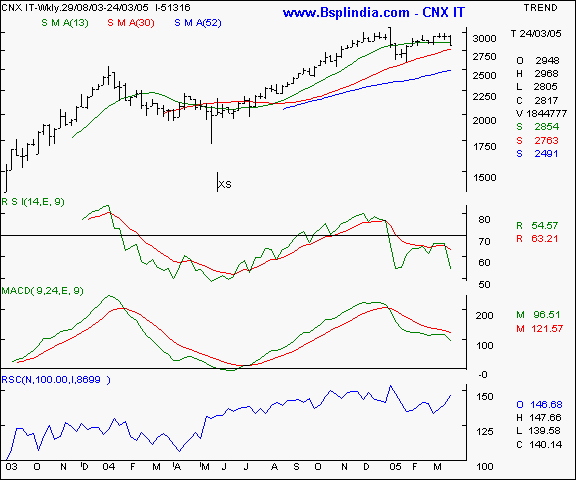
CNX IT - This IT index has been unable to surpass the 3000 levels convincingly and is showing a negative divergence on the charts. A fall below the 2760 levels will see a prolonged weakness and and fall to the 2635 is not ruled out.
Your call of action - Since this index's futures are not very liquid, we suggest trading the Nifty 50 instead.
Arvind Mills I Andhra Bank I BEL I HDFC I HDFC Bank I Hind Lever I HPCL I ITC I Reliance I SBI I Telco I Tata Power I UBI I BSE Sensex I Nifty I CNX-IT I Dow Jones I Nasdaq I FTSE I Top I Close window I Print page
|
Indices - international |
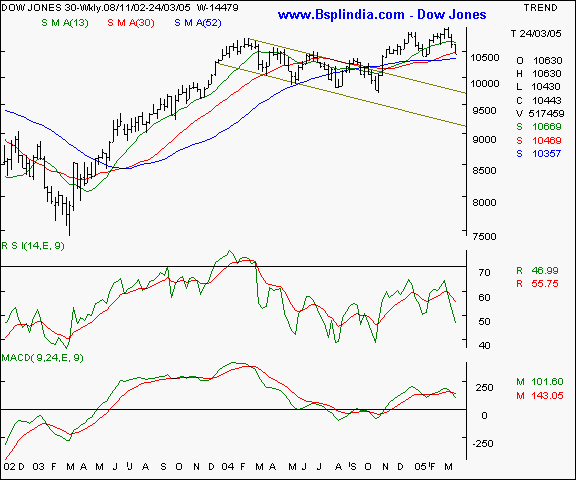
Dow Jones Industrial Average - The Dow has plunged yet again and is testing crucial short / medium term averages. Traders may watch the 10350 levels keenly for signs of trend determination and any fall below will lead to an accelerated fall. Upsides are restricted to the 10,665.
Your call of action - this is a pure academic study.
Arvind Mills I Andhra Bank I BEL I HDFC I HDFC Bank I Hind Lever I HPCL I ITC I Reliance I SBI I Telco I Tata Power I UBI I BSE Sensex I Nifty I CNX-IT I Dow Jones I Nasdaq I FTSE I Top I Close window I Print page
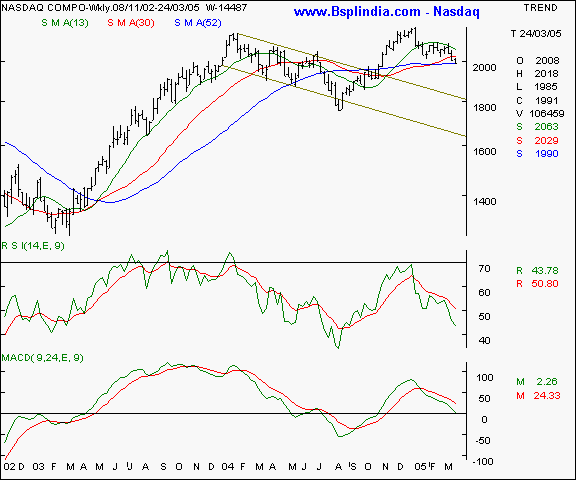
Nasdaq - This technology / biotech index is exhibiting similar chart patterns like the Dow and is critically poised at it's 52 week SMA. Upside resistance at the 2055 levels and support at the 1978 need to be watched carefully. The bias is towards a fall.
Your call of action - this is a pure academic study.
Arvind Mills I Andhra Bank I BEL I HDFC I HDFC Bank I Hind Lever I HPCL I ITC I Reliance I SBI I Telco I Tata Power I UBI I BSE Sensex I Nifty I CNX-IT I Dow Jones I Nasdaq I FTSE I Top I Close window I Print page
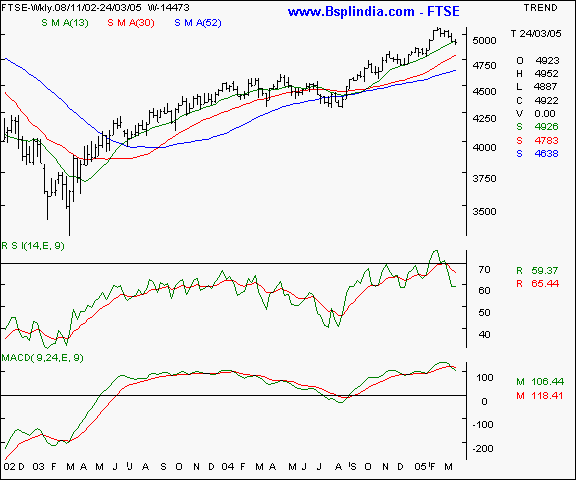
FTSE - This index though stronger than the US benchmarks in relative terms, is also exhibiting weakness. A fall to the 4765 levels is not ruled out and a close above the 5065 is a trigger for the bulls to watch out for, in the absolute short term.
Your call of action - this is a pure academic study.
Arvind Mills I Andhra Bank I BEL I HDFC I HDFC Bank I Hind Lever I HPCL I ITC I Reliance I SBI I Telco I Tata Power I UBI I BSE Sensex I Nifty I CNX-IT I Dow Jones I Nasdaq I FTSE I Top I Close window I Print page
|
Trading tips for the week |
-
The put / call ratio is falling and is currently at the 0.32 : 1 levels and the outstanding positions in the derivatives segment have shown a fall. That is a routine phenomena ahead of expiry. The FII investments are continuing to remain negative / slowing to a trickle.
-
There is offloading at higher levels in stock futures. That indicates a cautious approach as long positions in individual stocks is being hedged by Nifty shorts.
-
The current week is crucial for the markets as the year end and f&o expiry are converging on the market players.
-
The impeding expiry of the March series will see higher volatility in the coming week.
-
Trades must be executed in small volumes due to the higher volatility expected. Trade fewer counters and conserve cash for future opportunities.
-
Standby for fresh recommendations via SMS on a real - time basis.
- Have a profitable week.
- Vijay L Bhambwani
- Ceo :- Bsplindia.com
The author is a Mumbai based investment consultant and invites feedback at Vijay@BSPLindia.com and ( 022 ) 23438482 / 23400345.
SEBI disclosure :- The author has no positions in any securities mentioned above.
- While all due care has been taken while in compiling the data enclosed herein, we cannot be held responsible for errors, if any, creeping in. Please consult an independent qualified investment advisor before taking investment decisions. This mail is not sent unsolicited, and only advisory in nature. We have accepted no consideration from any company mentioned above and recommend taking decisions on merits of the stocks from our viewpoint. This email is being sent to you as a paid subscriber. Please protect your interests and ours by not disclosing the contents to any un-authorised person/s
Legal notice :- The Professional Ticker Reader is a trademark of Bhambwani Securities (P) Ltd. and any un-authorised replication / duplication in part or full will be infringing our trademark and will result in legal action being enforced on the infringing persons / parties.
