Global market indices - weekly feature - March 06, 2005
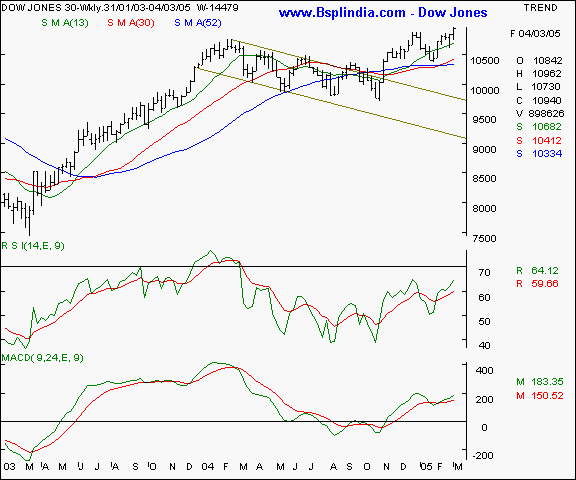
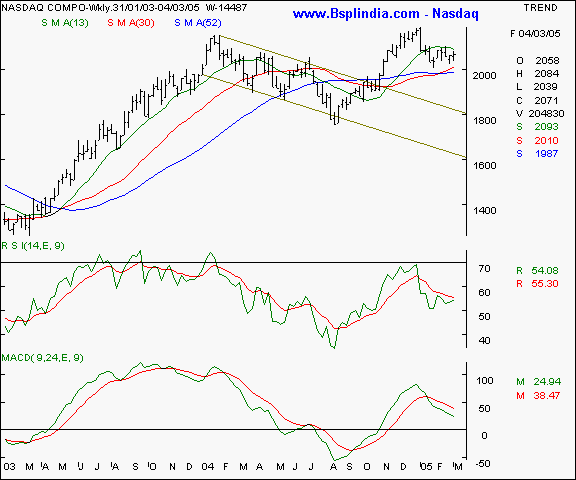
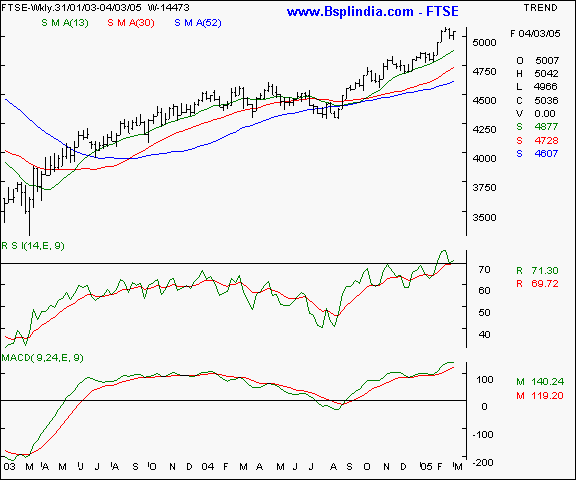
Dow Jones Industrial Average - this NYSE old economy benchmark is trading at it's 3 1/2 year highs and is showing signs of strength as a higher tops and bottoms formation is being signalled. The 13 week SMA is acting as a good support and is currently at the 10685 which is a floor for the medium term. We feel a conclusive and sustained close above the 11000 levels will be a bullish indicators for the global financial markets and will have a trickle down effect on the domestic markets also. The Dow has the potential to scale to the 11,200 levels in the coming fortnight. Your call of action - Since Indian investors are not allowed to trade in overseas markets, this is a pure academic study. Nasdaq - the Nasdaq is underperforming the Dow Jones and is likely to face resistance at the 2115 levels and support at the 2010 - 2020 levels. Unless a breakout / breakdown is signalled, we do not foresee a clarity in trend in the Nasdaq. The short term outlook is biased towards an upmove. Your call of action - Since Indian investors are not allowed to trade in overseas markets, this is a pure academic study. FTSE - This UK index is showing a secular upmove as the index is trading marginally higher than it's psychological resistance at the 5000 levels. The 4915 levels are the floor for the coming week and resistance is likely at the 5140 in the week ahead. Your call of action - Since Indian investors are not allowed to trade in overseas markets, this is a pure academic study. |
Your feedback is important ! Please click here to let us know your views. Click here to inform a friend about this page on our website.


