Global market indices - weekly feature - March 27, 2005
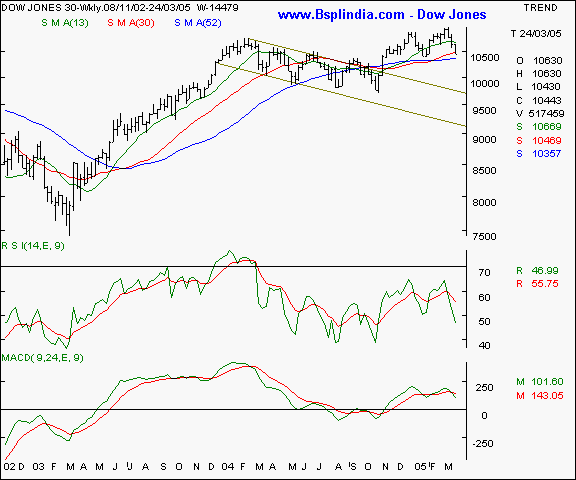
Dow Jones Industrial Average - The Dow has plunged yet again and is testing crucial short / medium term averages. Traders may watch the 10350 levels keenly for signs of trend determination and any fall below will lead to an accelerated fall. Upsides are restricted to the 10,665.
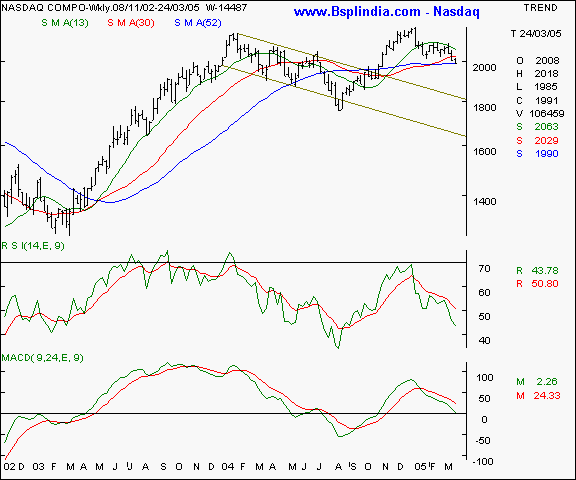
Your call of action - this is a pure academic study. Nasdaq - This technology / biotech index is exhibiting similar chart patterns like the Dow and is critically poised at it's 52 week SMA. Upside resistance at the 2055 levels and support at the 1978 need to be watched carefully. The bias is towards a fall.
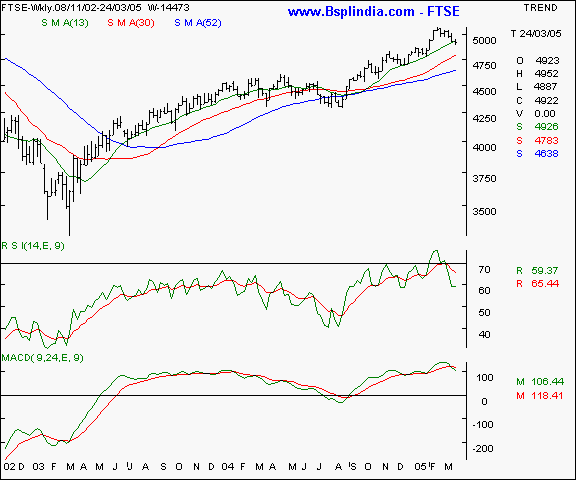
Your call of action - this is a pure academic study. FTSE - This index though stronger than the US benchmarks in relative terms, is also exhibiting weakness. A fall to the 4765 levels is not ruled out and a close above the 5065 is a trigger for the bulls to watch out for, in the absolute short term.
Your call of action - this is a pure academic study. |
Your feedback is important ! Please click here to let us know your views. Click here to inform a friend about this page on our website.