Flavours of the week May 01, 2005
These are stocks that we expect to out-perform the markets. Cash and derivative strategies are advised thereon. Please stay online to enable loading of graphics from our servers. Please also read the trading tips section at the end of the newsletter.
|
Individual stocks. |
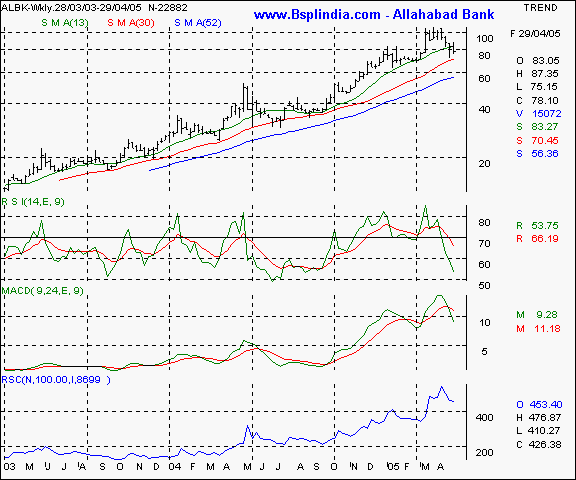
Allahabad Bank - This PSU bank is a turnaround story and the recent consolidation / correction is seeing the scrip witnessing profit taking by weaker hands. Currently, the oscillators are pointing towards a downward mood on the counter and the slide is likely to see the 70 levels where some buying may emerge. Technical traders may note the high relative strength of 453 vis-a-vis the Nifty 50 ( where 100 = base ) and the classic higher tops and bottoms formation. We recommend buying for the medium / long term traders / investors at 70 in small lots.
Your call of action -
-
Investors / cash segment players - Start nibbling in very small lots at the 70 - 71 levels with a room for averaging till the 58 levels. Maintain a stop loss at the 52 levels. We expect the scrip to test the 85 - 90 levels in the medium / long term in a conducive market scenario.
-
Aggressive F&O traders - Buy the June futures at lower levels of 72 in a declining market and hold with a deep stop loss at the 64 levels. Expect to book profit at the 78 / 79 levels in the short / medium term and 84 levels over a slightly longer term in a conducive market. Options players may buy the May 85 calls at a suggested premium of Re 0.60
-
Derivatives contract size - Market lot = 2,450 shares. F&O margin = approx Rs 45,000 (subject to change daily )
Allahabad Bank I BoB I BoI I Century I ITC I NTPC I Reliance Inds I Telco I UBI I BSE Sensex I Nifty I CNX-IT I Dow Jones I Nasdaq I FTSE I Top I Close window I Print page
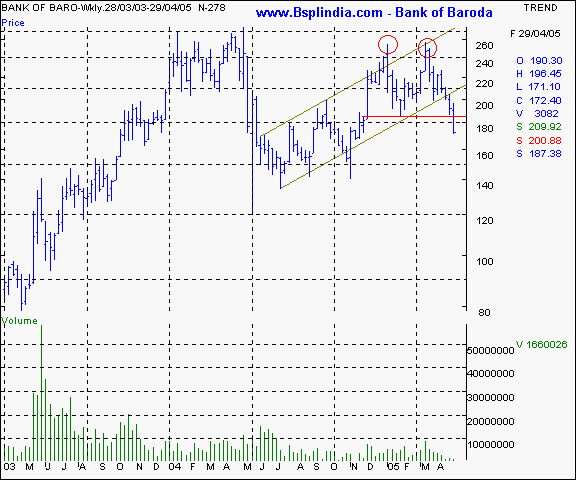
Bank of Baroda - Our investors will recollect our short sale recommendation on this scrip in the event of a fall below the 200 levels. The trade has been highly profitable and the scrip has exhibited interesting chart patterns. Technical traders will note the double tops formation marked by the two red circles. The critical support at the 184 levels marked by the red trend line has also been violated. The scrip has closed well below the bullish channel and the fall has been accompanied by poor volumes. Though a fall with poor volumes maynot mean absence of panic sales, the possibility of a minor pullback is not ruled out. Traders with a higher risk appetite are suggested to press shorts on major advances.
Your call of action -
-
Investors / cash segment players - n/a.
-
Aggressive F&O traders - Short the May futures in the event of a rally to the 182 - 184 levels and hold with a stop loss at the 195 mark. We expect the scrip to test the 160 - 162 levels in a conducive market scenario in the short / medium term. Income conscious players may sell the May 200 calls at a suggested premium of Rs 2 or higher.
-
Derivatives contract size - Market lot = 1,400 shares. F&O margin = approx Rs 48,000 (subject to change daily )
Allahabad Bank I BoB I BoI I Century I ITC I NTPC I Reliance Inds I Telco I UBI I BSE Sensex I Nifty I CNX-IT I Dow Jones I Nasdaq I FTSE I Top I Close window I Print page
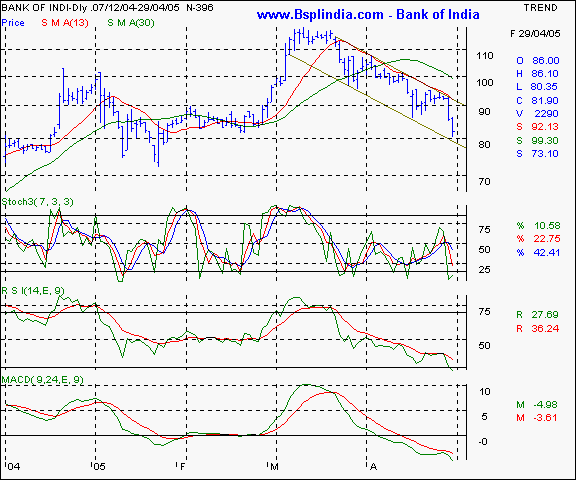
Bank of India - this scrip was also recommended as a short candidate at significantly higher levels and has paid off short sellers handsomely. The scrip has been moving in a downward sloping channel and has tested the channel bottom. The oscillators are showing a downward trend and we expect a weak undertone. Any bounce back in a rising market will be a trigger for short sellers to initiate fresh entry points.
Your call of action -
-
Investors / cash segment players - n/a.
-
Aggressive F&O traders - Short sell the May futures at significantly higher levels of 85 - 86 and hold with a stop loss at the 90 mark. Expect to book profits at the 76 - 78 levels in a short / medium term in a conducive market scenario. Income conscious players may sell the May 100 calls at a suggested premium of Re 1.
-
Derivatives contract size - Market lot = 1,900 shares. F&O margin = approx Rs 37,000 (subject to change daily )
Allahabad Bank I BoB I BoI I Century I ITC I NTPC I Reliance Inds I Telco I UBI I BSE Sensex I Nifty I CNX-IT I Dow Jones I Nasdaq I FTSE I Top I Close window I Print page
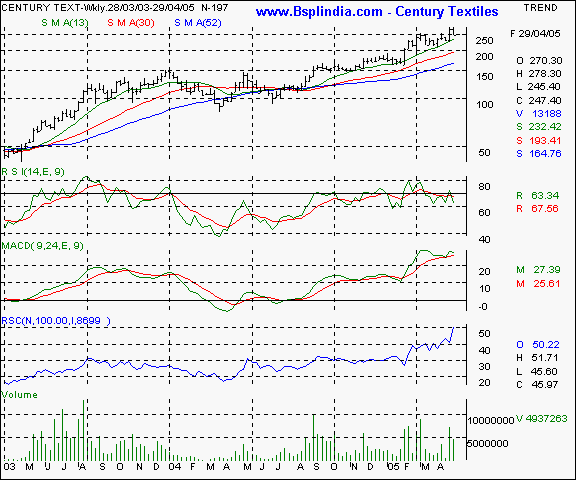
Century Textiles - This scrip has been a star performer among our mid cap recommendation over 6 months ago and has been promoted to the f&o list recently. That is likely to see higher volumes and an upward bias on the counter. The scrip has moved into a new trading zone and is unlikely to witness significant resistance at the current levels. The scrip is moving above it's moving averages and is making a rising tops and bottoms formation on the charts. Traded volumes have risen after the f&o inclusion. We recommend a buy for the patient investor.
Your call of action -
-
Investors / cash segment players - start buying at lower levels of 230 and leave room for averaging till the 195 - 200 levels. Hold with a stop loss at the 170 - 175 levels and expect to book profits at the 310 - 325 levels in the medium / long term in a conducive market.
-
Aggressive F&O traders - Buy the June futures on declines to the 230 - 235 levels and hold with a stop loss at the 215 levels. Expect to book profits at the 255 - 265 levels in the short / medium term in a conducive market. This trade is for very patient traders only.
-
Derivatives contract size - Market lot = 850 shares. F&O margin = approx Rs 45,000 (subject to change daily )
Allahabad Bank I BoB I BoI I Century I ITC I NTPC I Reliance Inds I Telco I UBI I BSE Sensex I Nifty I CNX-IT I Dow Jones I Nasdaq I FTSE I Top I Close window I Print page
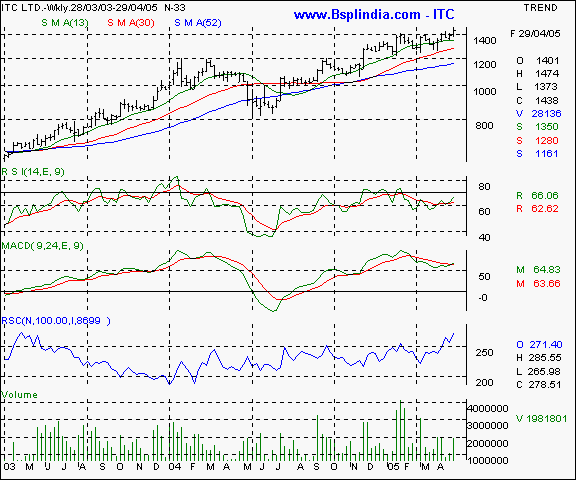
ITC Ltd - This scrip was recommended on multiple occasions in our newsletters and has lived up to our expectations. The scrip has confirmed a breakout into a new high and is unlikely to witness severe resistance at these levels. Technical traders may note the high relative strength of 271 vis-a-vis the Nifty ( where 100 = base ). The oscillators are showing a rising trend and we expect the scrip to test higher levels and lead the market rally from the front.
Your call of action -
-
Investors / cash segment players - Start buying small / medium lots at the 1400 - 1420 levels and leave room for averaging till the 1325 levels. Maintain a stop loss at the 1280 mark and expect to book profits above the 1650 levels in the long term in a conducive market scenario.
-
Aggressive F&O traders - buy the June futures at lower levels of 1400 - 1410 ( currently quoting at Rs 22 discount to cash ) and average lower till the 1360 mark. Maintain a stop loss at the 1330 and expect to book profits at the 1470 - 1490 in the short / medium term. Long term traders can expect significantly higher levels.
-
Derivatives contract size - Market lot = 150 shares. F&O margin = approx Rs 37,000 (subject to change daily )
Allahabad Bank I BoB I BoI I Century I ITC I NTPC I Reliance Inds I Telco I UBI I BSE Sensex I Nifty I CNX-IT I Dow Jones I Nasdaq I FTSE I Top I Close window I Print page
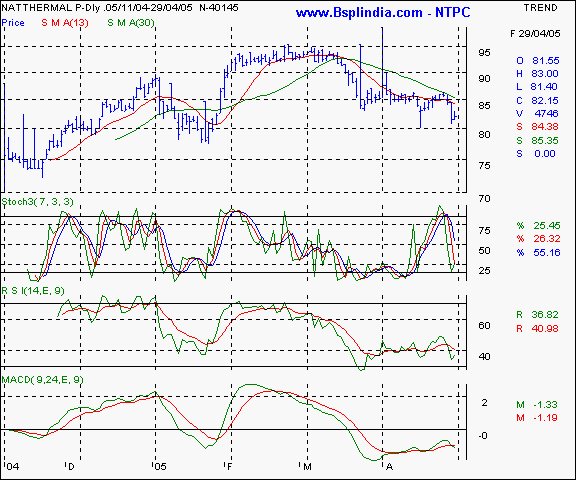
NTPC - This PSU power major has retraced sharply from the all time highs of 95 levels and is likely to witness buying support from the 80 levels onwards. Advanced retracement studies point towards limited downsides below the 78 mark and we recommend a buy for the discerning investor with a longer term view.
Your call of action -
-
Investors / cash segment players - Buy the scrip on lower levels of 80 - 81 with a room for averaging till the 75 levels if these levels are seen. Hold with a stop loss at the 70 levels and expect to book profits at the 100 + levels in a years time frame.
-
Aggressive F&O traders - Buy the June futures at lower levels of 80 - 80.50 and hold with a stop loss at the 76. Expect to book profits at the 85 / 86 in the short / medium term in a conducive market scenario. Income conscious players may Sell the May 95 calls at a suggested premium of Re 0.45 in small lots.
-
Derivatives contract size - Market lot = 3,250 shares. F&O margin = approx Rs 43,000 (subject to change daily )
Allahabad Bank I BoB I BoI I Century I ITC I NTPC I Reliance Inds I Telco I UBI I BSE Sensex I Nifty I CNX-IT I Dow Jones I Nasdaq I FTSE I Top I Close window I Print page
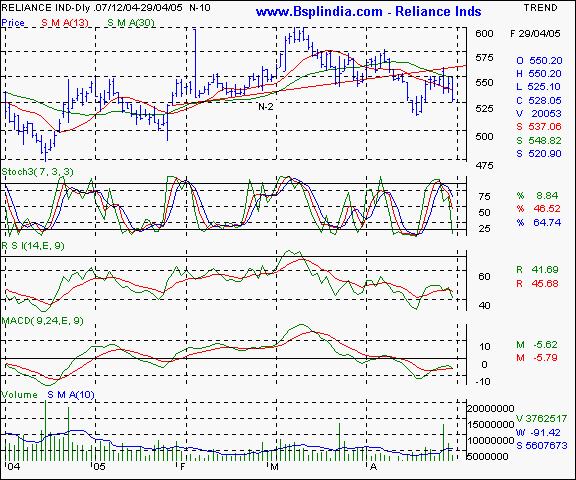
Reliance Inds - This scrip was recommended on the long side in February and achieved it's target levels of 600. Thereafter, a short sale recommendation was made as the counter displayed a head and shoulder formation once the 548 mark was violated. Being a measuring move, it is possible to forecast the downside target which stands at the 505 - 510 levels. The neckline marked by the red trend line is likely to be the resistance area and we recommend a short sale. The momentum oscillators are pointing towards a fall and upsides are likely to be capped.
Your call of action -
-
Investors / cash segment players - n/a.
-
Aggressive F&O traders - Short sell the May futures at slightly higher levels of 531 - 532 and hold with a stop loss of 542. Expect to book profits at the 515 - 518 levels in a conducive market scenario in the short / medium term. Income conscious traders may sell the May 580 calls at a suggested premium of Rs 3.50 and above in small lots only.
-
Derivatives contract size - Market lot = 600 shares. F&O margin = approx Rs 55,000 (subject to change daily )
Allahabad Bank I BoB I BoI I Century I ITC I NTPC I Reliance Inds I Telco I UBI I BSE Sensex I Nifty I CNX-IT I Dow Jones I Nasdaq I FTSE I Top I Close window I Print page
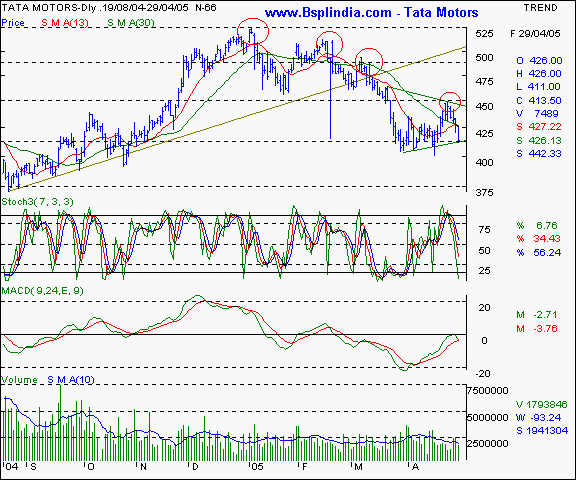
Tata Motors - this scrip was recommended as a short sell on multiple occasions and has moved in a short term wedge as the graphic below indicates. The noteworthy aspect is the lower tops formation which is indicated by the red circles. In the last 5 weeks, the scrip has made a rising bottoms formation as indicated by the green short term trend-line. Any convincing breakdown below the 408 / 409 levels is an indicator of weakness on the counter and we recommend a short sale on that bearish confirmation.
Your call of action -
-
Investors / cash segment players - n/a.
-
Aggressive F&O traders - Short sell the may futures below the 405 levels and hold with a stop loss at the 412 levels. Expect to book profits at the 395 partially and the 388 levels completely in a conducive market scenario in the short / medium term. Income conscious players may sell the May 450 calls in small lots at a suggested premium of Rs 4. Options players may buy the May 400 puts at a suggested premium of Rs 8.
-
Derivatives contract size - Market lot = 825 shares. F&O margin = approx Rs 60,000 (subject to change daily )
Allahabad Bank I BoB I BoI I Century I ITC I NTPC I Reliance Inds I Telco I UBI I BSE Sensex I Nifty I CNX-IT I Dow Jones I Nasdaq I FTSE I Top I Close window I Print page
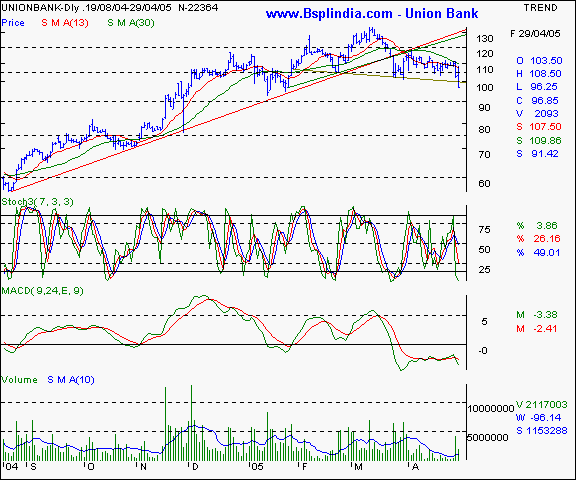
Union Bank - This scrip was recommended as a short sale on multiple occasions and has been a good trade ever since it broke the 112 levels. It maybe noted that the scrip has confirmed a bearish head and shoulder formation and has enable us to forecast a price objective of 82 in a conducive market scenario in the medium term scenario. Technical traders may note that the falls are accompanied by higher volumes, which is a sign of weakness. We recommend a short sale on the counter.
Your call of action -
-
Investors / cash segment players - n/a.
-
Aggressive F&O traders - Short sell the May futures on advances to the 100 - 101 levels and hold with a stop loss at the 104 levels. Expect to book profits at the 90 - 92 levels in the short / medium term in a conducive market. Patient short sellers may expect lower levels. Income conscious traders may sell the May 115 calls at a suggested premium of Rs 1.75 in small lots.
-
Derivatives contract size - Market lot = 900 shares. F&O margin = approx Rs 34,000 (subject to change daily )
Allahabad Bank I BoB I BoI I Century I ITC I NTPC I Reliance Inds I Telco I UBI I BSE Sensex I Nifty I CNX-IT I Dow Jones I Nasdaq I FTSE I Top I Close window I Print page
|
Indices - domestic |
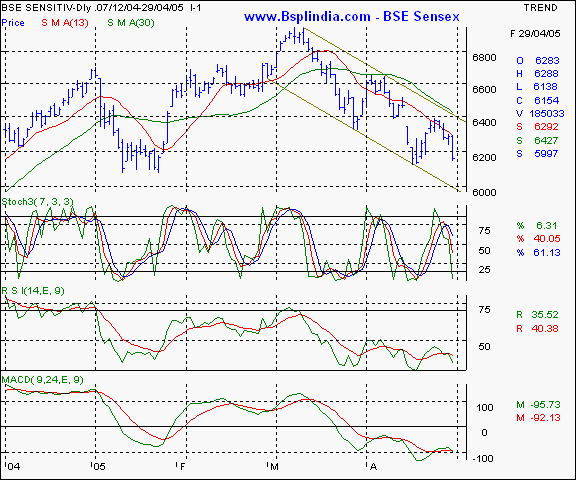
BSE Sensex - this BSE benchmark is in a downward sloping channel and has a confirmed lower tops and bottoms formation which is indicating further selling the coming weeks. Since the index has been unable to surpass the 13 day SMA convincingly, we expect the previous bottom to be violated in the short / medium term. The oscillators are in sell mode and any upsides will be short term pullbacks only. We maintain a bearish outlook on the counter.
Your call of action - Since the Sensex futures are not very liquid, we suggest trading the Nifty 50 instead.
Allahabad Bank I BoB I BoI I Century I ITC I NTPC I Reliance Inds I Telco I UBI I BSE Sensex I Nifty I CNX-IT I Dow Jones I Nasdaq I FTSE I Top I Close window I Print page
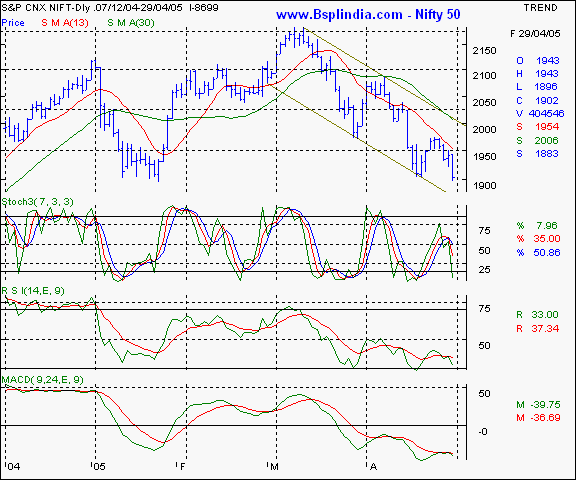
Nifty 50 - The Nifty was advocated as having support at the 1888 levels ( spot ) and has almost reached those levels. Our short selling bias on the Nifty has been highly profitable and we maintain our view that upsides are selling entries for fresh trades. It maybe noted that the oscillators too are showing lower tops and are likely to see lower levels on the spot price. Maintain a bearish bias at higher levels, only the high risk appetite traders may attempt bottom fishing in anticipation of a bounce back.
Your call of action - We expect some support at the 1888 levels in the spot and very adventurous traders may buy at those levels. Hold with a stop loss at the 1872 levels. Expect a bounce to see the 1918 - 1924 levels. On the higher side, start pressing short sales if the spot reaches 1938 - 1942 levels and hold with a stop loss at the 1958 levels. Expect profit taking below the 1908 mark. Income conscious players may sell the May 2100 calls at a suggested premium of Rs 4 and above.
Allahabad Bank I BoB I BoI I Century I ITC I NTPC I Reliance Inds I Telco I UBI I BSE Sensex I Nifty I CNX-IT I Dow Jones I Nasdaq I FTSE I Top I Close window I Print page
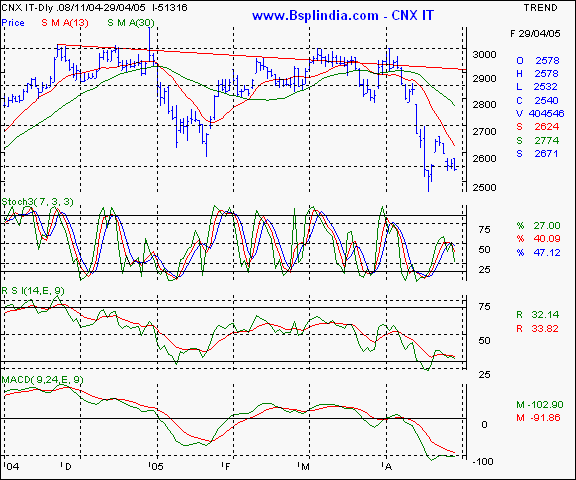
CNX IT - This index was advocated by us as a bearish benchmark as the multiple resistance at the red trendline is indicating a strong resistance. The 2600 support of Jan 2005 has been convincingly violated and the upsides are likely to be limited to the 13 day SMA which is currently poised at the 2625 levels. We recommend a bearsih bias on this index on advances.
Your call of action - Since the CNX IT futures are not very liquid, we suggest trading the Nifty 50 instead.
Allahabad Bank I BoB I BoI I Century I ITC I NTPC I Reliance Inds I Telco I UBI I BSE Sensex I Nifty I CNX-IT I Dow Jones I Nasdaq I FTSE I Top I Close window I Print page
|
Indices - international |
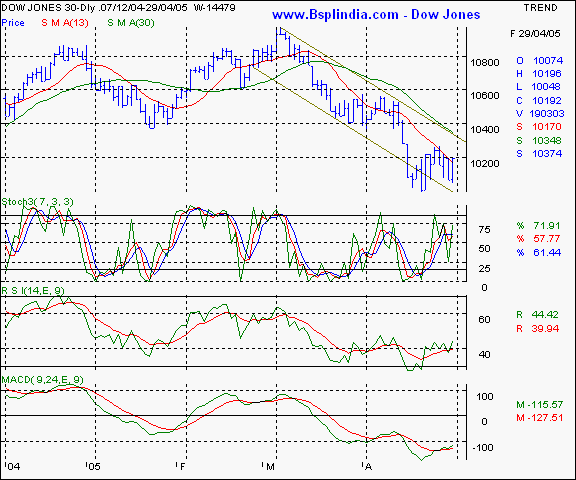
Dow Jones Industrial Average - this NYSE index is clearly in a bearish channel and the crucial 10,000 levels are proving to be a short term floor around which this index is finding support. Only a sustained closing above 10290 will the outlook turn positive. The main trigger that the US markets are awaiting is the US FOMC meet on Tuesday ( Wednesday in India ) which will set the pace for the markets. The oscillators are pointing towards a possible bullishness which needs to be confirmed by the price graph surpassing the 10290 levels.
Your call of action - this is a pure academic study.
Allahabad Bank I BoB I BoI I Century I ITC I NTPC I Reliance Inds I Telco I UBI I BSE Sensex I Nifty I CNX-IT I Dow Jones I Nasdaq I FTSE I Top I Close window I Print page
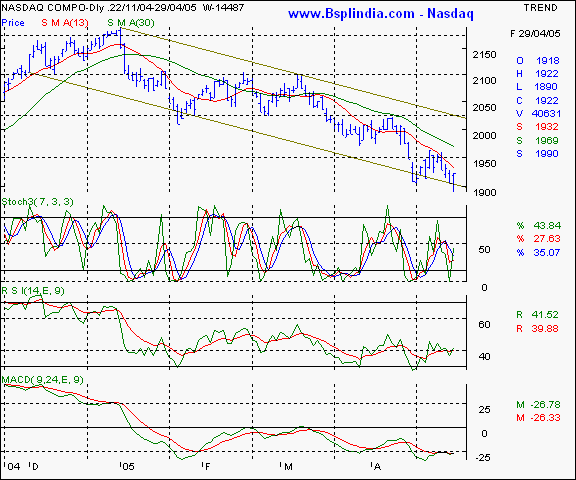
Nasdaq - like the Dow Jones, the Nasdaq too is moving within a bearish channel and is just about managing to stay above the 1900 levels. Only a sustained trade above the 1960 levels will see a short term trend reversal. The FOMC meet is a crucial event the markets are awaiting and a clear trend will emerge only thereafter. Watch the 1900 mark on a closing basis very keenly.
Your call of action - this is a pure academic study.
Allahabad Bank I BoB I BoI I Century I ITC I NTPC I Reliance Inds I Telco I UBI I BSE Sensex I Nifty I CNX-IT I Dow Jones I Nasdaq I FTSE I Top I Close window I Print page
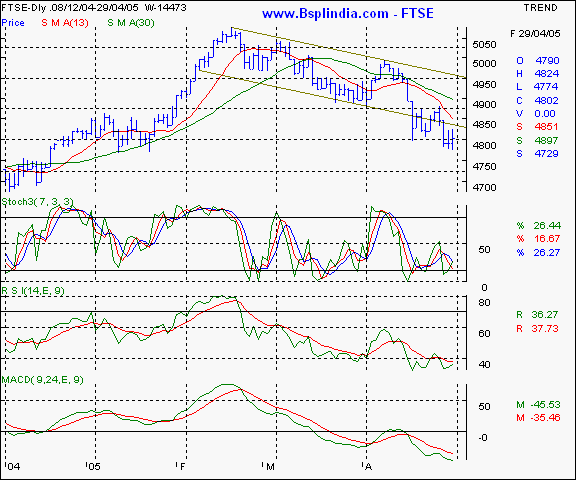
FTSE - This index has actually violated the bearish channel and trades below it since the last 3 sessions. Upsides are likely to be capped at 4870 and a sustained fall below the 4760 levels will trigger fresh sales till the 4710 mark in the short term.
Your call of action - this is a pure academic study.
Allahabad Bank I BoB I BoI I Century I ITC I NTPC I Reliance Inds I Telco I UBI I BSE Sensex I Nifty I CNX-IT I Dow Jones I Nasdaq I FTSE I Top I Close window I Print page
|
Trading tips for the week |
-
The put / call ratio is currently at the 0.27 : 1 levels and the outstanding positions in the derivatives segment have shown a qualitative fall. The FII investments are continuing to remain negative.
-
There is offloading at higher levels in stock futures. That indicates a cautious approach as long positions in individual stocks is being hedged by Nifty shorts.
-
The current week is crucial for the markets as the US Fed FOMC meet will signal the direction of the US economy. That in turn will determine the domestic market trends.
-
Trades must be executed in small volumes due to the higher volatility expected. Trade fewer counters and conserve cash for future opportunities.
-
Standby for fresh recommendations via SMS on a real - time basis.
- Have a profitable week.
- Vijay L Bhambwani
- Ceo :- Bsplindia.com
The author is a Mumbai based investment consultant and invites feedback at Vijay@BSPLindia.com and ( 022 ) 23438482 / 23400345.
SEBI disclosure :- The author has no positions in any securities mentioned above.
- While all due care has been taken while in compiling the data enclosed herein, we cannot be held responsible for errors, if any, creeping in. Please consult an independent qualified investment advisor before taking investment decisions. This mail is not sent unsolicited, and only advisory in nature. We have accepted no consideration from any company mentioned above and recommend taking decisions on merits of the stocks from our viewpoint. This email is being sent to you as a paid subscriber. Please protect your interests and ours by not disclosing the contents to any un-authorised person/s
Legal notice :- The Professional Ticker Reader is a trademark of Bhambwani Securities (P) Ltd. and any un-authorised replication / duplication in part or full will be infringing our trademark and will result in legal action being enforced on the infringing persons / parties.

