Global market indices - weekly feature - May 08, 2005
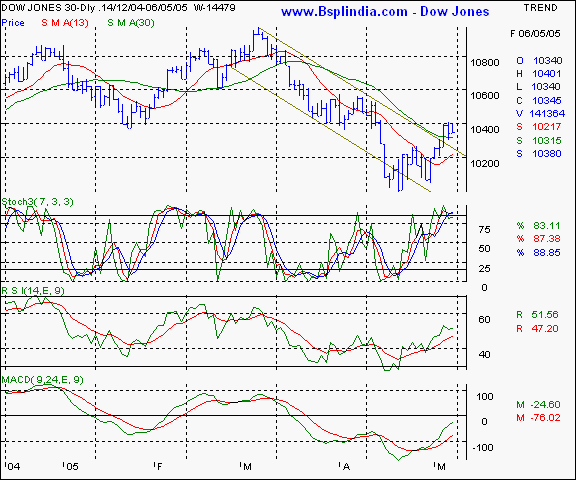
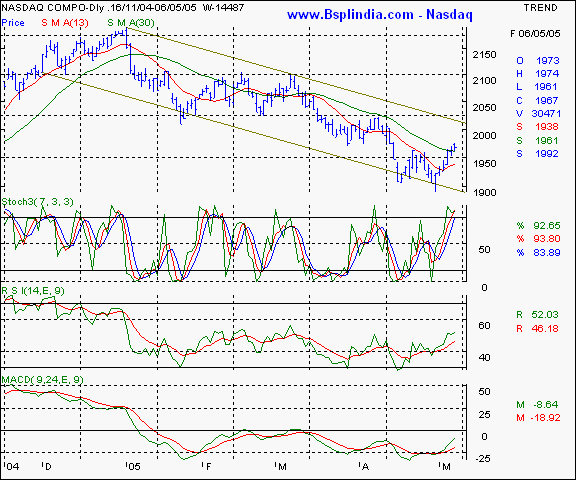
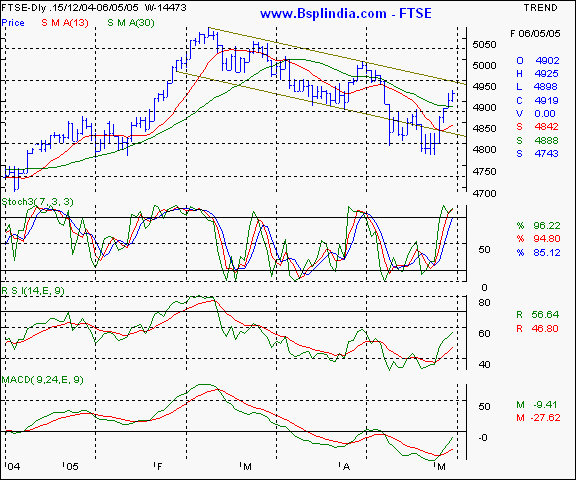
Dow Jones Industrial Average - the Dow has signaled a breakout from the bearish channel and is likely to derive support at the 10300 levels in the short term. Resistance on the upsides are likely at the 10400 levels. Only after a consistent trade above the 10400 mark, will the Dow make a fresh upmove. Your call of action - this is a pure academic study. Nasdaq - the Nasdaq is moving within the 5 month old channel and is making a rising tops and bottoms formation. The 30 day SMA has been surpassed and the likelihood of 1990 - 2000 levels is good. On lower levels, expect support at the 1944 levels in the near term. Your call of action - this is a pure academic study. FTSE - this index has seen a higher relative strength as compared to the US indices. The index has rallied for 4 consecutive days and is likely to test the 4950 - 4965 levels in the coming days. Support at lower levels is likely at the 4865 levels. Your call of action - this is a pure academic study |
Your feedback is important ! Please click here to let us know your views. Click here to inform a friend about this page on our website.


