Global market indices - weekly feature - May 15, 2005
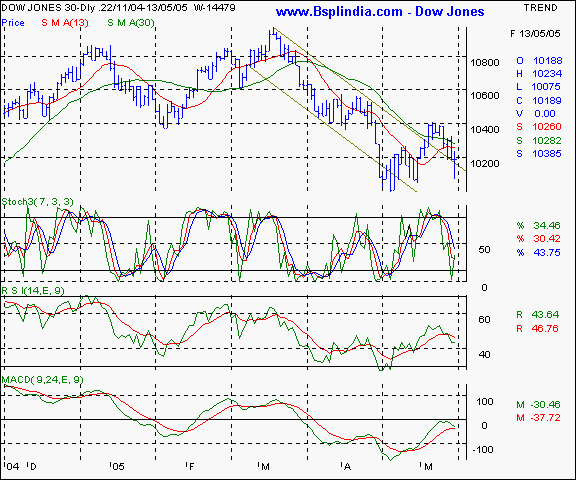
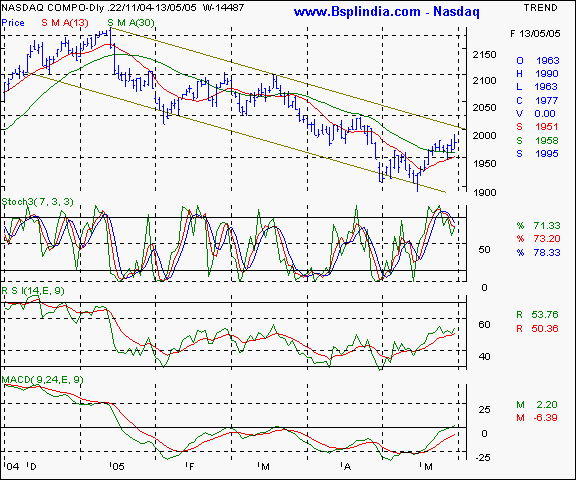
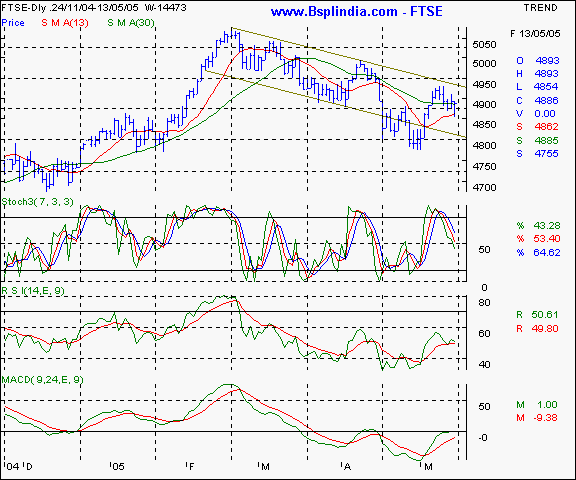
Dow Jones Industrial Average - the Dow has fallen for four days out of five last week and has managed to close above the channel top by a narrow margin. A sustained closing below the 10155 levels will see the index testing the 10,000 mark and the upsides are likely to be capped at the 10290 levels. Your call of action - this is a pure academic study. Nasdaq - the Nasdaq has higher relative strength as compared to the Dow Jones and is likely to appreciate to the 2000 levels in a conducive market scenario. The 1950 levels will be a crucial threshold support in the near term. It would interesting to see whether the 2000 levels are surpassed on a convincingly consistent basis. The domestic technology scrips are likely to take their cues from the Nasdaq. Your call of action - this is a pure academic study. FTSE - This UK index is making an interesting chart pattern as the index gyrates within the the bearish channel and a fall below the 4848 levels will see accelerated weakness. A rally past the 4920 is required to confirm a short term uptrend. Your call of action - this is a pure academic study |
Your feedback is important ! Please click here to let us know your views. Click here to inform a friend about this page on our website.


