Global market indices - weekly feature - May 22, 2005
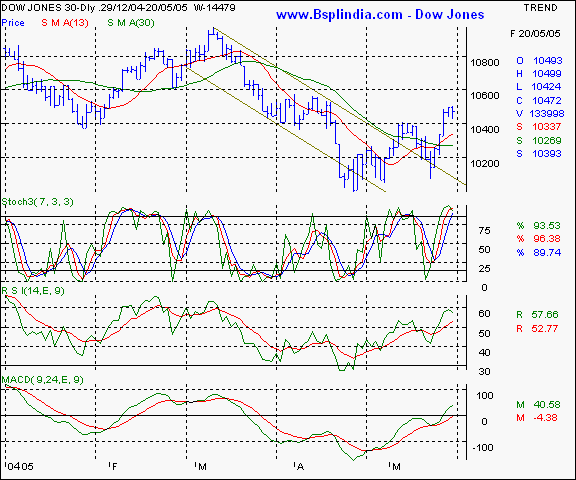
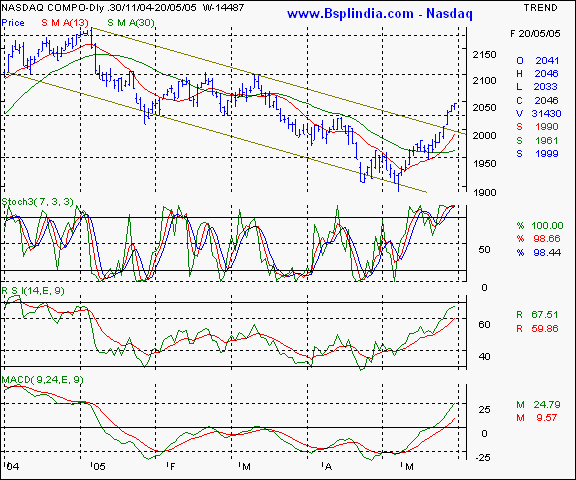
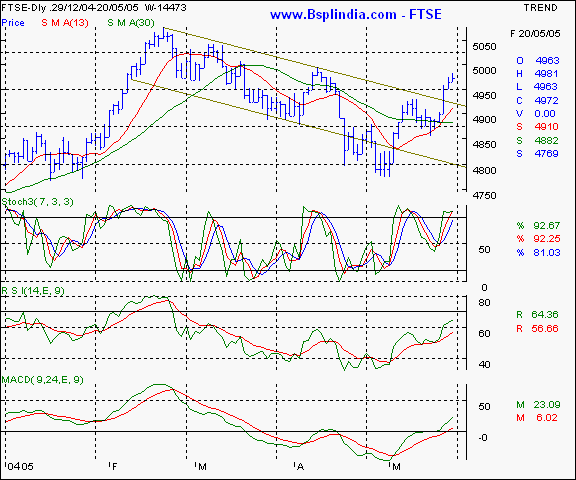
Dow Jones Industrial Average - this NYSE index has hit a new high after April 12 2005. The bearish channel has been surpassed and the oscillators are supporting the rally. We feel the 10330 levels are a critical support area and the 10525 levels are a short term target, beyond which the 10580 levels are achiveable. Your call of action - this is a pure academic study. Nasdaq - This technology laden index is showing strength like the Dow Jones and is above the 2035 resistance mark. The 2005 remains a good support and the 2084 - 2095 levels are a target in the coming week, if the markets remain bullish. Your call of action - this is a pure academic study. FTSE - this UK index is near it's congestion at the 5000 mark and the rally so far has been strong. Support is expected at the 4935 and resistance at the 5040 levels. Your call of action - this is a pure academic study |
Your feedback is important ! Please click here to let us know your views. Click here to inform a friend about this page on our website.


