Global market indices - weekly feature - May 29, 2005
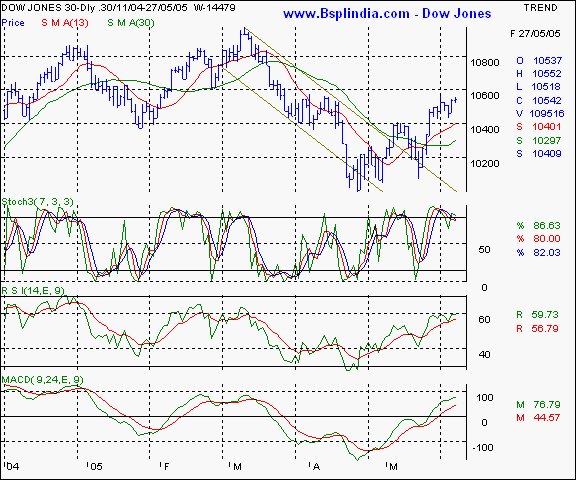
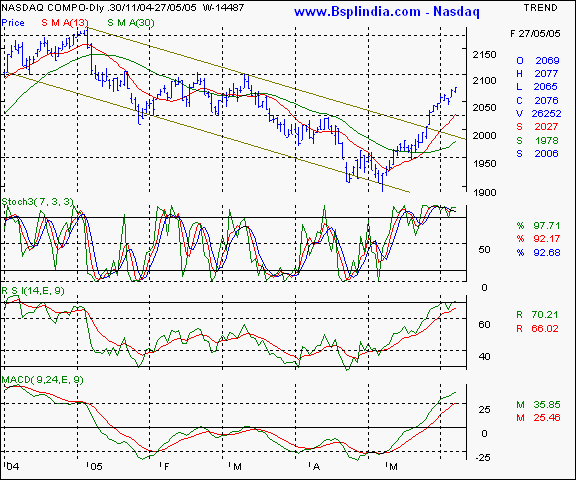
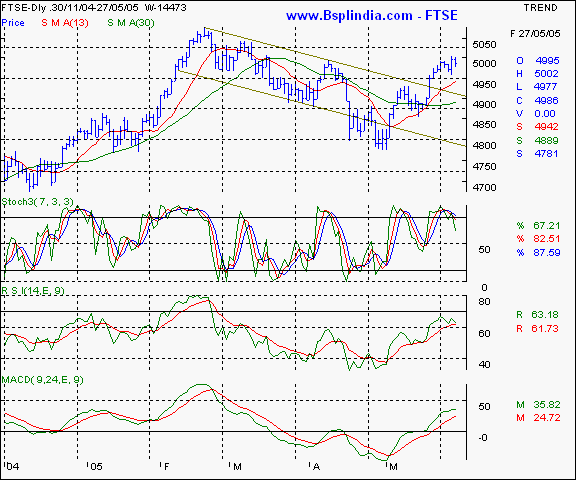
Dow Jones Industrial Average - this old economy index is showing signs of fatigue at higher levels and needs to stay above the 10400 levels to stay bullish. The upside resistance at the 10580 will be the development to watch. we expect resistance at higher levels. Your call of action - this is a pure academic study Nasdaq - this new economy index is showing a sustained strength after a breakout above the bearish channel. We feel the 2100 levels will be a strong resistance and multiple tops are witnessed at that level. On the downside, watch the 2020 levels for support. Your call of action - this is a pure academic study FTSE - this UK index is showing signs of sustaining the breakout above the bearish channel and is likely to get support at the 4950 levels. The 5014 levels will be an effective resistance in the short term. A sustained close above this resistance will be the bullish trigger for fresh upmoves. Your call of action - this is a pure academic study. |
Your feedback is important ! Please click here to let us know your views. Click here to inform a friend about this page on our website.


