- The Professional Ticker Reader TM
- Your accurate, authentic and affordable guide to investing
Midcap stocks of the week Sept 19, 2004
The Mid cap stocks listed below are Nifty 500 components - liquid, traded easily and benchmarked volatility. These are stocks that we expect to out-perform the markets. It should be remembered that many of these stocks are trading with abnormally high volumes, maybe operator driven, and have appreciated significantly. Therefore, the risk element is likely to be very high. Take limited exposure to these stocks and maintain stop losses as specified.
|
Individual stocks. |
Ashima - this textile story is a beneficiary of the re-rating of the textile segment. Lower cotton prices, export potential of the sector is witnessing polarised volume action on the sector. The scrip below is trading with high volumes, significantly higher than it's 10 day average ( depicted clearly in the graphic ) and the oscillators are supporting the upmove. We recommend a trading buy on the counter.
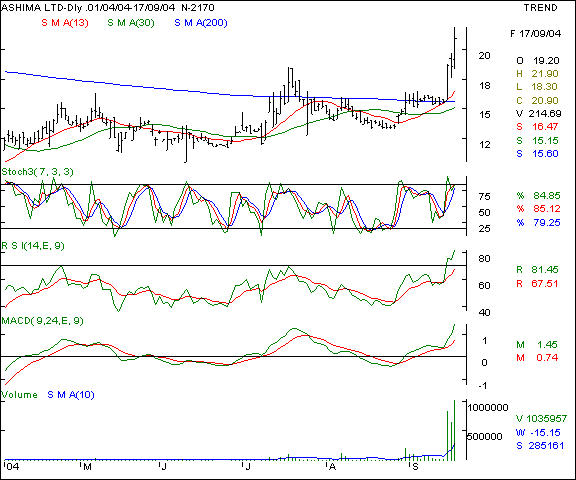
Your call of action - Buy at 20 levels and maintain a stop loss at the 16.50 mark. Expect to book profits at the 25 / 27 mark in the near term in a conducive market.
Asian Hotels - this hotel scrip is rallying with a higher tops and bottoms formation. The moving averages are rising in tandem with the price graph. Traded volumes are rising, which is a positive indicator. Should the scrip surpass the 217 levels, the stock goes into a no resistance zone which will see little buying pressure propelling the prices higher. We recommend a buy as the coming year end will see higher tourist inflows in the holiday season.
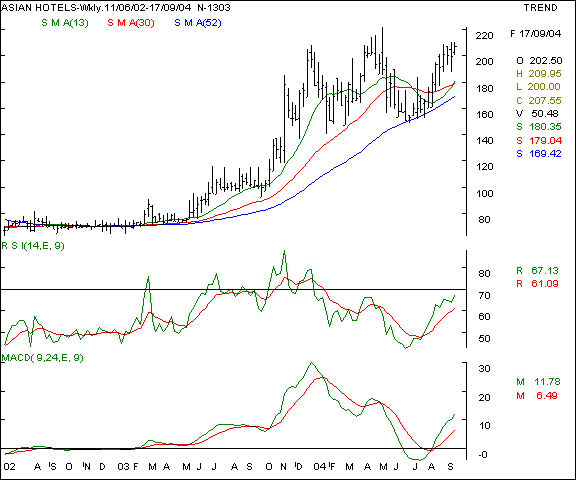
Your call of action - Buy the stock in a rising market above the 216 levels with a stop loss at the 202 levels. Expect to book profits at the 234 levels atleast partially and 245 completely.
Atul Ltd- This pharma player is witnessing a rally past it's 52 week SMA which is a positive indicator. The stock is trading near it's calendar year highs and the oscillators are making a classic saucer formation. Should the 40 levels not be breached downwards, the uptrend is likely to continue. We recommend a trading buy on the counter.
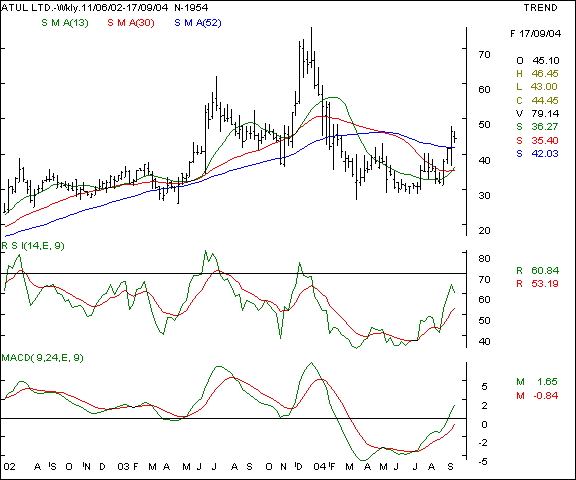
Your call of action - Buy above the 45 levels and hold with a stop loss at the 40 mark. Expect to book profits at the 52 / 54 mark in a conducive market in the short / medium term.
Bajaj Hindustan - This sugar major is in an uptrend and trading with brisk volumes. The stock needs to clear the previous resistance levels and that too with higher volumes of over 3 lac shares, to trigger a buy.
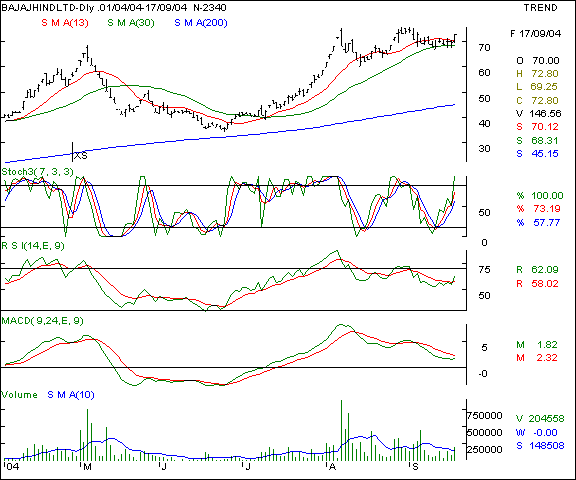
Your call of action - Buy above the 76 levels especially if the volumes are above 3 lac shares and maintain a stop loss at the 71 levels. Expect to book profits at the 85 levels partially and at 90 levels completely.
Bongaigaon Refineries - this standalone refinery is witnessing a breakout above it's 200 day SMA and that too with volumes three time over it's 10 day average ( refer volumes window in the graphic below ). The oscillators are rising in tandem with the prices and traders are advocated to take long positions in small lots.
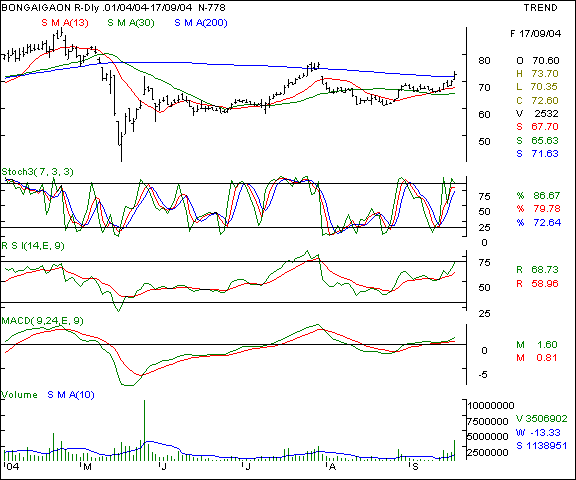
Your call of action - buy in small lots above the 74 levels and maintain a stop loss at the 70.50 with a profit target of 78 / 80 levels in a conducive market in the short term.
Century Textiles - this Birla group concern is showing signs of a bullish formation as the cotton textiles story is robust, what with falling cotton prices and the company's aggressive marketing plans in the ready-made garments. The stock is showing signs of consolidation with lower volumes after a 30 % upmove in 6 weeks. We advocate a buy only on a breakout above the previous highs at the 165 levels or on major declines to the 145 levels.
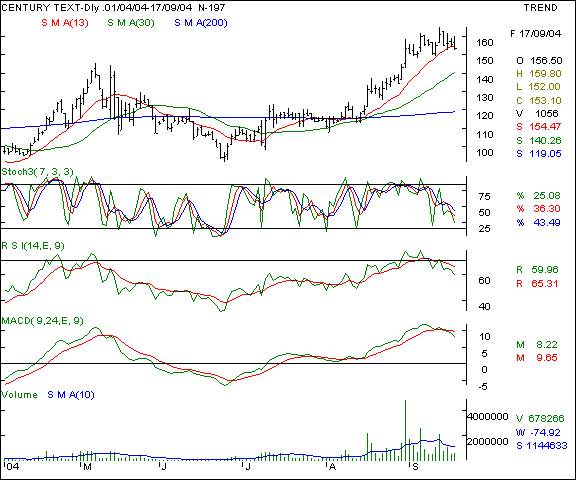
Your call of action - Scenario # 1 - buy on declines at the 145 levels with a stop loss at the 133 levels and expect to book profits at the 157 levels.
Scenario # 2 - buy on a breakout above the 166 levels with a stop loss at the 158 levels. Expect to book profits at the 178 in the near term in a firm market.
CESC - this electricity generating company is in the midst of restructuring operations. The same is reflected on the share price as the stock has moved up fron 75 to the 115 levels in a span of 3 months. The oscillators are keeping pace with the price graph and we recommend a trading buy in small lots on advances.
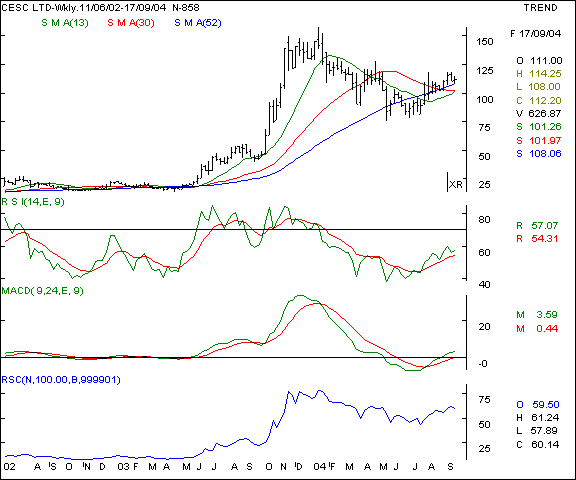
Your call of action - buy above the 115 levels with a stop loss at the 103 levels. Expect profit taking at the 128 partially and by 134 levels completely in a conducive market in the near / medium term.
Creative Eye - this media counter is showing signs of a revival as a rounding bottom formation is underway on the charts. The traded volumes are fairly good and the oscillators are showing a rising trend in the offing. We recommend a high risk / speculative buy for the adventurous trader. Being a penny stock, the downsides are likely to be capped.
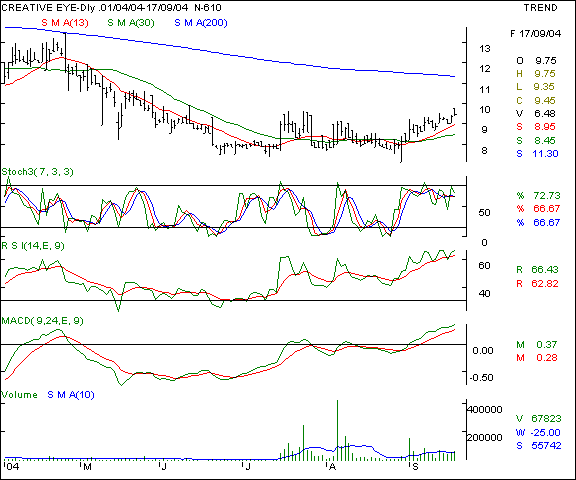
Your call of action - Buy at the 9 - 10 levels with a stop loss at the 7.75 mark, expect profit taking at the 11 - 12 levels in a conducive market in the near term.
Cummins India - this diesel engine MNC major is a market out performer as the relative strength index shows a 200 % gain over the Sensex. The stock is in a bull groove and the sales growth in the automobile segment is likely to boost this company's prospects. A little known fact is that the company makes engines from the 15 - 15,000 bhp range, finding applications in pumps to tug boats. We recommend a buy for the discerning investor with patience. Above a sustained closing over the 130 levels, the stock goes into a low resistance new trading zone.
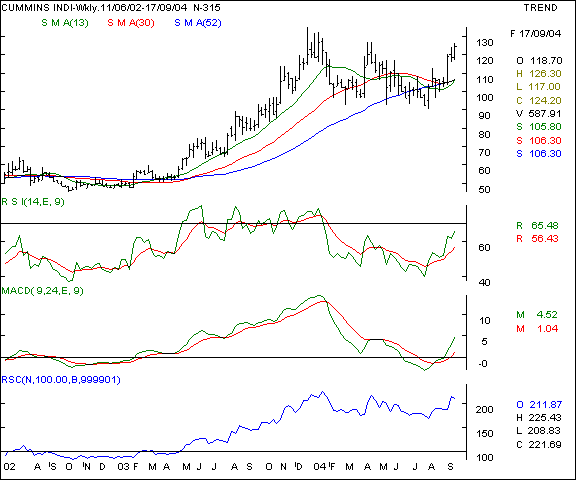
Your call of action - Buy the scrip above the 130 levels and hold with a stop loss loss at the 118 levels, expecting to book profits at the 145 - 150 levels in a conducive market in the short / medium term.
Dabur India - this is another pharma / fmcg player in the mid cap segment. The management is aggressively restructuring the operations and the perception is changing from a family owned company to a professionally run organisation. The scrip is hovering around it's congestion level of 75 levels, which is also it's 52 week SMA. Should a convincing close be achieved above this, expect a faster upmove.
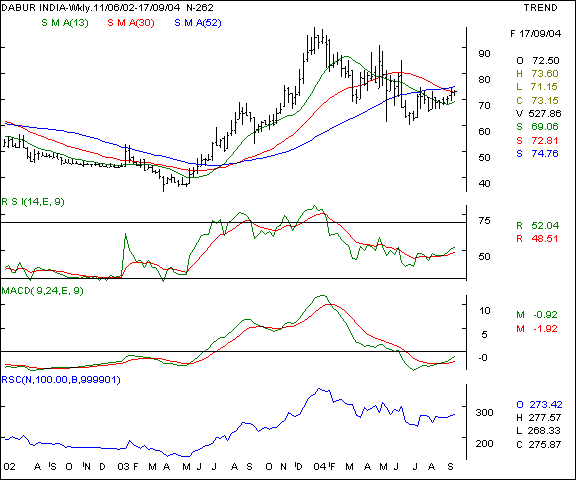
Your call of action - Buy the scrip above the 75 levels and hold with a stop loss at the 69 levels, expecting to book profits at the 82 levels.
Engineers India - This scrip is making a saucer formation on the charts as the volumes have risen above the 10 day average. Since the scrip has relatively lower volumes, we advocate lower exposure and adherence to the stop loss levels. The oscillators are pointing to the possibility of a further upmove as the stock is likely to test it's 200 day SMA at the 300 - 310 levels.
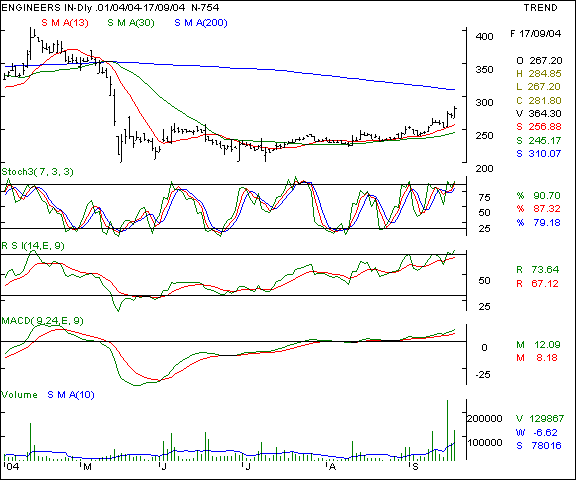
Your call of action - Buy the scrip at the current levels ( 280 ) and hold with a stop loss at the 265 levels. Await 300 - 305 levels to book profits in a bullish market.
HEG Ltd - this mid cap counter is witnessing a surge with higher volumes and the scrip is critically poised under it's 200 day SMA at the 84 levels. Buying is recommended on a breakout. The oscillators point towards a further upside.
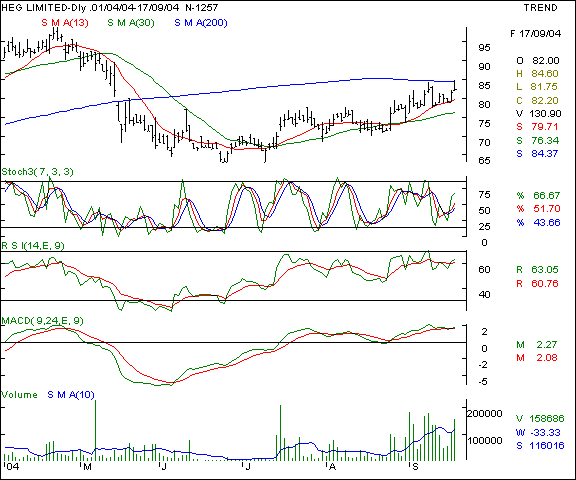
Your call of action - Buy above the 85 levels and maintain a stop loss at the 80 levels, expecting to book profits at the 92 - 94 levels in a conducive market in the near term.
Hind Oil Exploration - this counter has been in the trader focus since a few months and has risen with high volumes as the graphic depicts. Since the run up has been substantial, we recommend buying on declines only.
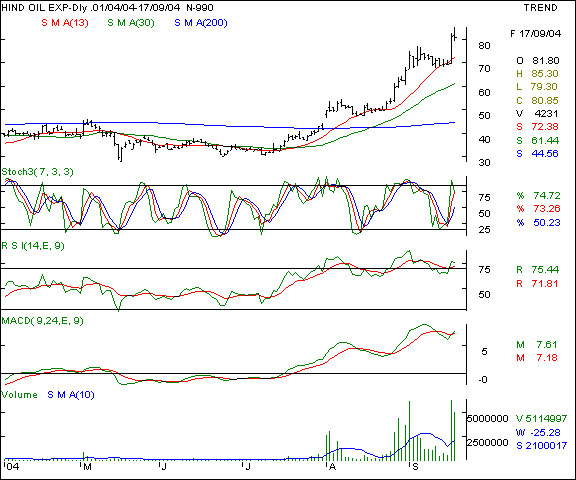
Your call of action - Buy at the 72 - 75 levels and hold with a stop loss at the 68 levels. Expect profit taking at the 88 - 90 levels in a conducive market in the near / medium term.
Hinduja TMT - This technology and convergence candidate is making a rising tops and bottoms formations as the chart shows. This highly volatile counter witnesses good volume action too and will signal a breakout above the 277 levels in the near term. The 13 day SMA has been a rough and ready support in the near term. We recommend a trading buy on the counter.
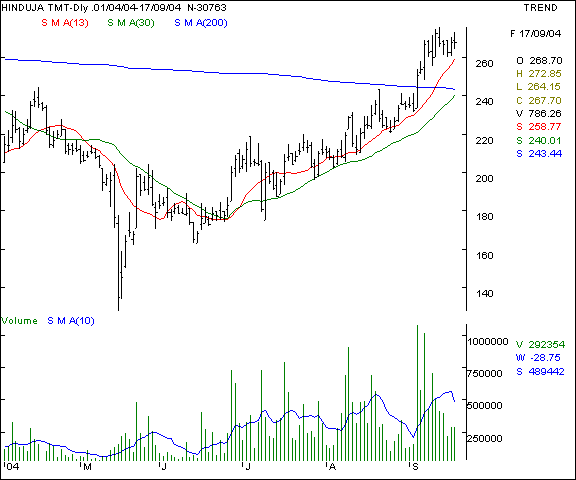
Your call of action - Buy the scrip above the 270 levels if the volumes exceed 3 lac shares and hold with a stop loss at the 264 levels. Book half profits at the 277 levels and should the scrip breakout above this congestion level, expect the 285 levels in a hurry.
Hughes Software - This software major is showing a classic bullish chart pattern as the the price graph is showing a breakout above it's short term congestion levels since it closed above the 560 levels. The stock is near it's 5 month highs and should it manage to stay above the 570 levels, expect the 620 - 630 levels in a few weeks in a conducive market.
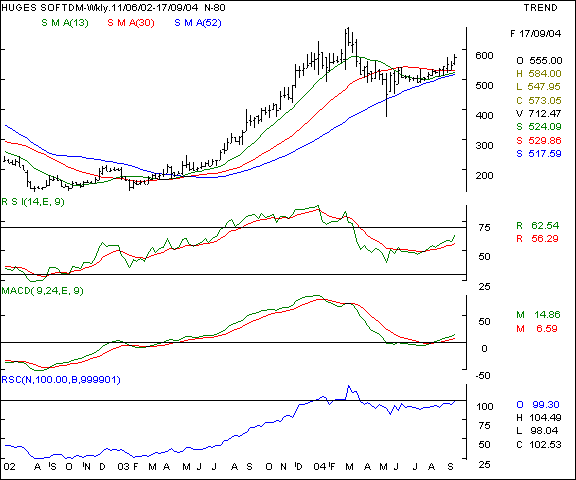
Your call of action - Buy at the current levels ( 575 ) and hold with a stop loss at the 555 levels. Expect to book profits at the 610 - 625 levels in a few weeks in a conducive market.
Indian Hotels - This hotels and hospitality major is showing classic signs of an upmove and the triggers are a robust improvement in the F&B ( foods and beverages ) business, occupancy rates and the upcoming holiday season, wherein more travellers are expected. Above the 430 levels, the stock is in a low resistance area and is likely to move up to the 465 levels. We recommend a buy.
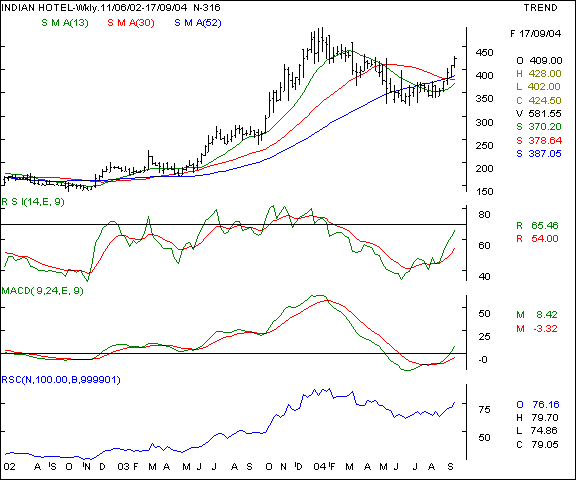
Your call of action - Buy above the 430 levels with a stop loss at the 400 levels and expect to exit partially at the 460 - 465 levels. In a conducive market, we expect the 480 levels to be a possibility.
Mahindra Ugine - This scrip is showing a classic saucer formation on the charts as the counter hit a 5 year high as the monthly chart below shows. The volumes have perked up and the oscillators are showing a rising trend as further upsides are likely. We recommend a buy on the counter for patient traders / investors.
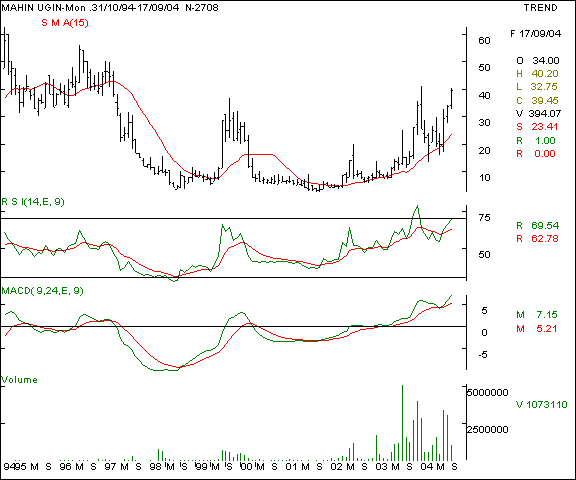
Your call of action - buy for delivery at the 40 level or above and hold with a stop loss at the 30 - 31 levels, expecting to book profits at the 50 levels in a conducive market in 4 - 6 weeks.
Raymond Ltd - This textiles major is showing a higher tops and bottoms formation as the chart shows below. The oscillators are making a saucer formation and the stock is a market out-performer as the relative strength index shows. A sustained closing above the 230 levels will be a bullish factor for the stock as the stock will be propelled over the calendar year highs into a low resistance area. We recommend a buy on the counter.
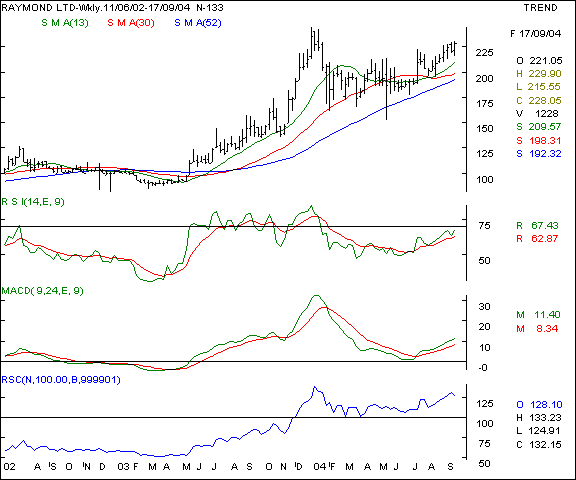
Your call of action - Buy over the 230 levels and hold with a stop loss at the 218 levels, expecting to book profits at the 245 levels partially and 255 levels completely.
RPG Lifesciences - This RPG group company is showing signs of an upmove as the chart below shows. The traded volumes have spiked up and the stock has more than doubled in price in the last two months and is a buy on declines.
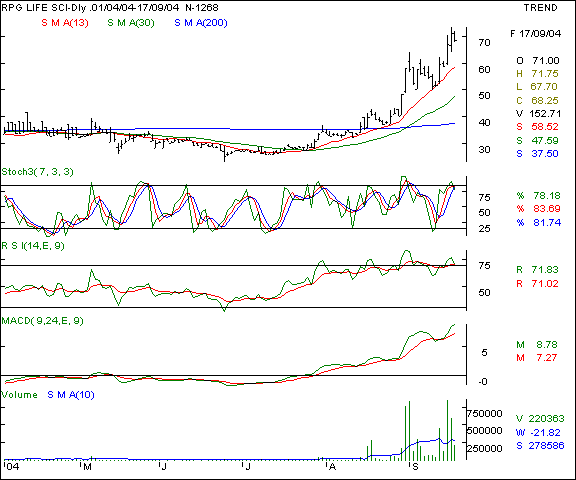
Your call of action - buy on declines upto the 60 mark and hold with a stop loss at the 50 levels which is an erstwhile flag formation ( not shown in the graph ). Expect profit taking at the 75 - 80 levels in a conducive market in the near / medium term.
Samtel Colour - This TV component manufacturer is moving up with a sharp increase in volumes and is approaching what is known as a double top formation in technical parlance. A clear close above the 65 levels in the near term will see the the stock testing the 73 - 75 levels in a conducive market. The oscillators and volumes support the upmove. The stock is a market out-performer as the relative strength indicator shows.
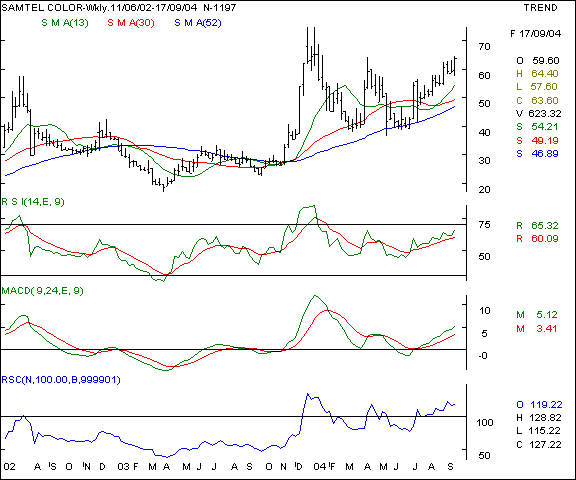
Your call of action - Buy the scrip above the 65 levels on higher volumes and hold with a stop loss at the 59 levels. Expect profit booking at the 73 - 75 levels in a conducive market in the short / medium term.
South India Bank - This banking story appears to be gaining momentum as the inflation fears recede and the rising interest rates do not appear as an immediate occurance. The counter has seen a perk up in volumes and the oscillators are supporting the upmove and a breakout above the 50 levels will give an upward impetus to the counter. We recommend a buy on that breakout.
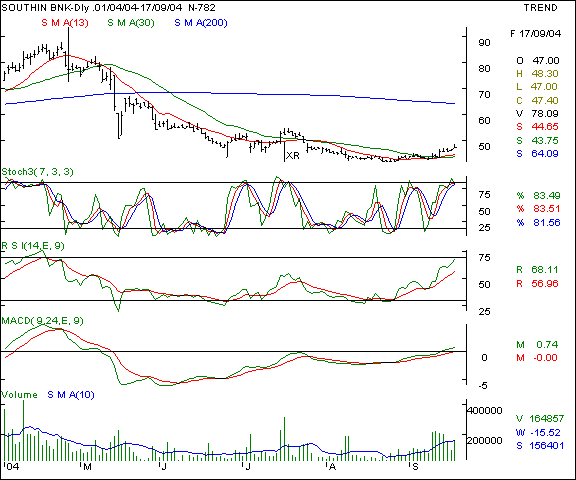
Your call of action - Buy above the 50 mark and and hold with a stop - loss at the 46 levels, expecting to book profits at the 56 - 58 in the near term in a conducive marrket.
Tata Sponge - this ferrous metals scrip is making a higher tops formation and is currently consolidating near it's 2 month highs and getting good support at it's short and medium term averages ( 13 & 30 days ) which can be utilised as stop loss levels. We recommend a buy.
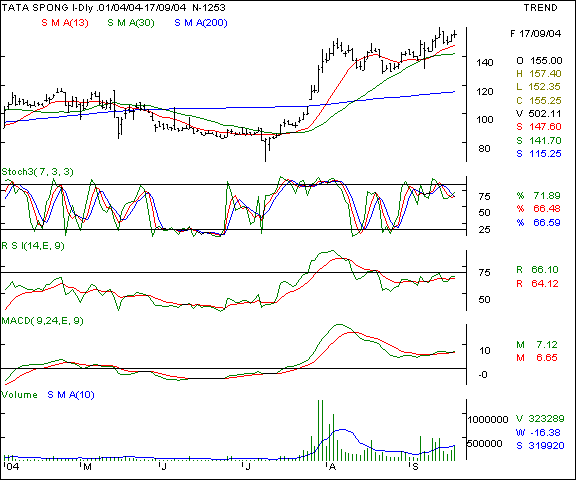
Your call of action - Buy the scrip on a breakout above the 161 levels and hold with a stop loss at the 146 levels. Expect to book part profits at the 180 levels and total profits at the 188 levels.
Travel Finance Corp of India - This penny stock is showing a huge spike in volumes and a breakout above the 200 day SMA, which is a buy trigger in the short term for aggressive / high risk players. The exposure must be kept really small as this is a high risk recommendation.
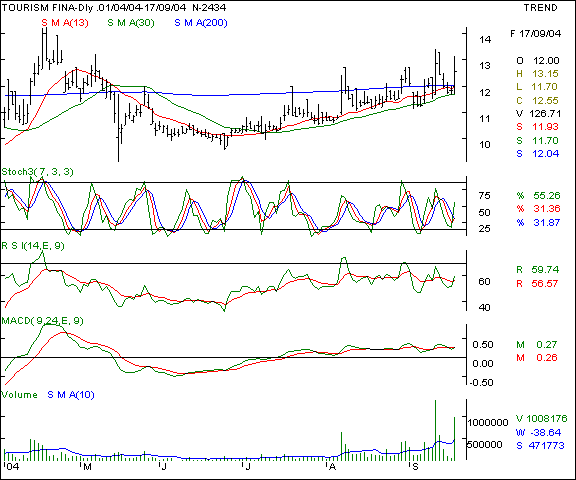
Your call of action - buy above the 13 levels and hold with a stop loss at the 11.50 levels. Expect to book profits at the 14.50 - 15 levels in the near term. We repeat - keep the purchased quantities small.
Voltas - This scrip is nearing it's Dec ' 03 highs and that too with decent volumes. Being a market out-performer with relative strength higher than the BSE sensex, this is a buy for the patient investors - above the breakout the upmove will be accelerated as the scrip enters the low resistance area.
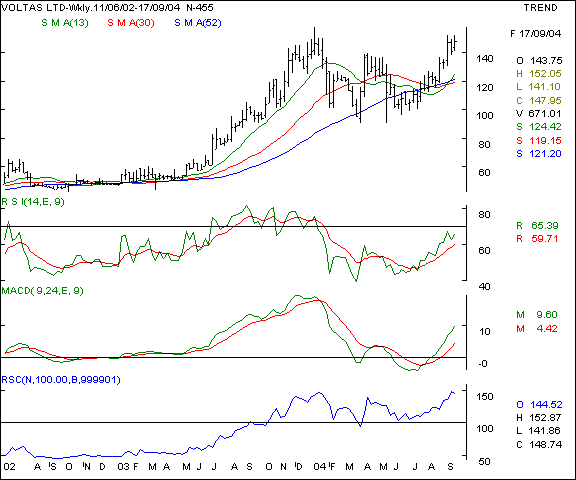
Your call of action - Buy above the 158 levels and hold with a stop loss at the 144 levels and a price target of Rs 175 in the near / medium term.
- Have a profitable week.
- Vijay L Bhambwani
- Ceo :- Bsplindia.com
The author is a Mumbai based investment consultant and invites feedback at Vijay@BSPLindia.com and ( 022 ) 23438482 / 23400345.
SEBI disclosure :- The author has no positions in any securities mentioned above.
- While all due care has been taken while in compiling the data enclosed herein, we cannot be held responsible for errors, if any, creeping in. Please consult an independent qualified investment advisor before taking investment decisions. This mail is not sent unsolicited, and only advisory in nature. We have accepted no consideration from any company mentioned above and recommend taking decisions on merits of the stocks from our viewpoint. This email is being sent to you as a paid subscriber. Please protect your interests and ours by not disclosing the contents to any un-authorised person/s
Legal notice :- The Professional Ticker Reader is a trademark of Bhambwani Securities (P) Ltd. and any un-authorised replication / duplication in part or full will be infringing our trademark and will result in legal action being enforced on the infringing persons / parties.