- Your accurate, authentic and affordable guide to investing
Flavours of the week Nov 21, 2004
These are stocks that we expect to out-perform the markets. Cash and derivative strategies are advised thereon. Please stay online to enable loading of graphics from our servers. Please also read the trading tips section at the end of the newsletter.
|
Individual stocks. |
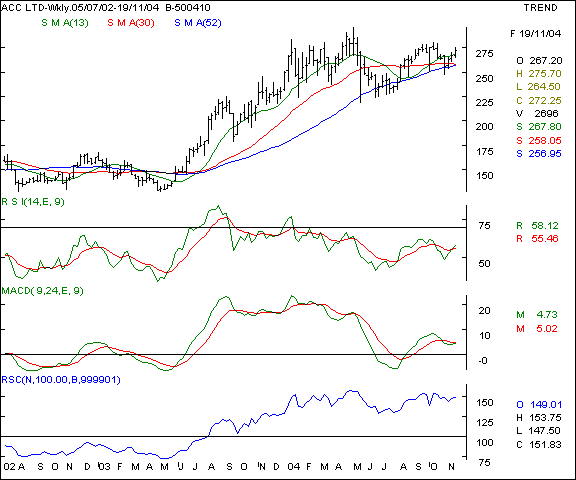
ACC - This cement major is showing signs of bucking the market trend as the scrip has gained on a week-on-week basis. The scrip has not closed below the 52 week SMA, which itself is in a rising trend. The scrip is a market out-performer with the relative strength oscillator showing a reading of 150 ( 100 = equal weight ). We would recommend a buy on advances once the previous top is surpassed with higher volumes.
Your call of action - .
-
Investors / cash segment players - buy only after a conclusive close above the 282 levels on higher volumes and hold with a stop loss at the 270 levels. Profit taking is likely to be completed between the 291 - 295 levels in a highly conducive market. We recommend a thin exposure on this scrip as large moves on this counter are difficult.
-
Aggressive F&O traders - Buy the December futures ( trading at Rs 2 premium to cash ) above the 283 levels and hold with a stop loss at the 276 levels. Expect profit taking at the 290 levels in a highly conducive market only.
-
Derivatives contract size - Market lot = 1500 shares. F&O margin = approx Rs 69,000 (subject to change daily )
ACC I Dr Reddy I Glaxo I HDFC I Infosys I IPCL I Raymond I Reliance I BSE Sensex I Nifty I CNX-IT I Dow Jones I Nasdaq I FTSE I Top I Close window I Print page
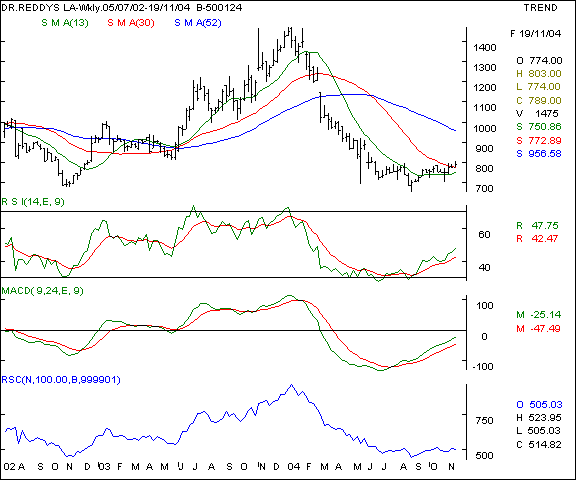
Dr Reddy - This scrip was recommended earlier this month in this edition above the 775 levels and profits were successfully booked at the 800 levels. We expect the higher volatility in the markets in the coming days to benefit the pharmaceuticals sector. This is because the sector is perceived to be a defensive play. Technically speaking, the scrip is making a rounding bottoms formation and showing signs of strength on the charts. We recommend a buy only if the scrip stays above the 800 mark on a closing basis.
Your call of action - .
-
Investors / cash segment players - Buy the scrip only if it manages to close above the 800 levels and maintain a stop loss at the 775 levels. We expect a Rs 50 appreciation if the markets are conducive.
-
Aggressive F&O traders - Buy the December futures as long as the spot price stays above the 800 mark. Maintain a stop loss of Rs 20 - 25 and aim for a profit target of Rs 35 - 40. Buy in small quantities with a patient approach.
-
Derivatives contract size - Market lot = 200 shares. F&O margin = approx Rs 27,000 (subject to change daily )
ACC I Dr Reddy I Glaxo I HDFC I Infosys I IPCL I Raymond I Reliance I BSE Sensex I Nifty I CNX-IT I Dow Jones I Nasdaq I FTSE I Top I Close window I Print page
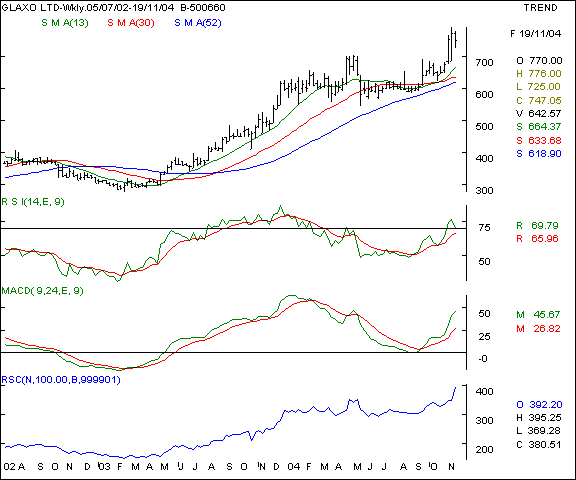
Glaxo Pharma - This scrip has been often repeated in this edition and has rewarded investors in the last 3 weeks. The pharma sector being a defensive play will be the biggest positive for this counter. As the 2005 deadline for the product patents regime approaches, we expect the stock price to harden. Buying is advocated on declines for the discerning investor. Technical analysts should note the high relative strength and the consistent higher tops and bottoms formation on the counter.
Your call of action - .
-
Investors / cash segment players - Buy the scrip at the 725 levels in a declining market and keep room for averaging till the 690 mark - if the price falls to that extent. Maintain a liberal stop loss at the 675 levels and expect profit taking at the 785 partially and 810 completely in the medium term in a conducive market.
-
Aggressive F&O traders - F&O n/a.
-
Derivatives contract size - F&O n/a.
ACC I Dr Reddy I Glaxo I HDFC I Infosys I IPCL I Raymond I Reliance I BSE Sensex I Nifty I CNX-IT I Dow Jones I Nasdaq I FTSE I Top I Close window I Print page
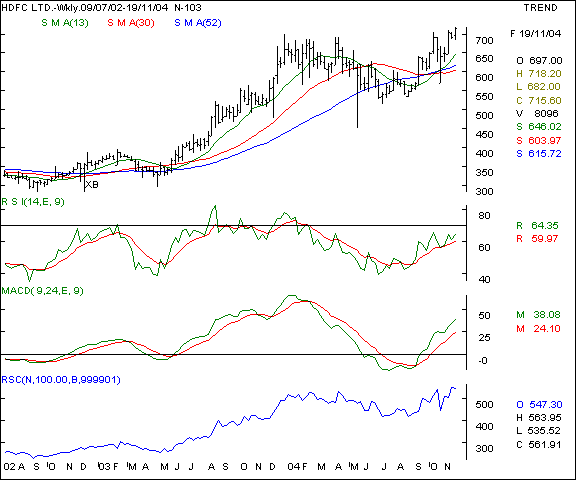
HDFC - this housing finance major is a market out-performer and a very high relative strength counter as the graphic below depicts. The hardening interest rates are a trigger for the scrip in the near term. The stock trades at a new high and in a new trading zone where there is unlikely to be any serious resistance. As long as the scrip stays above the 700 mark, the outlook is likely to remain bullish. We recommend a buy for the medium / long term investors.
Your call of action - .
-
Investors / cash segment players - Buy only if the scrip stays above the 700 mark, or, it rallies past the 700 mark after a fall and hold with a stop loss at the 650 - 660 levels. Expect profit taking at the 775 levels in the medium term.
-
Aggressive F&O traders - Buy the December futures series above the 700 levels and hold with a stop loss at the 674 levels. Expect profit taking at the 745 - 750 levels in a conducive market scenario.
-
Derivatives contract size - Market lot = 600 shares. F&O margin = approx Rs 67,000 (subject to change daily )
ACC I Dr Reddy I Glaxo I HDFC I Infosys I IPCL I Raymond I Reliance I BSE Sensex I Nifty I CNX-IT I Dow Jones I Nasdaq I FTSE I Top I Close window I Print page
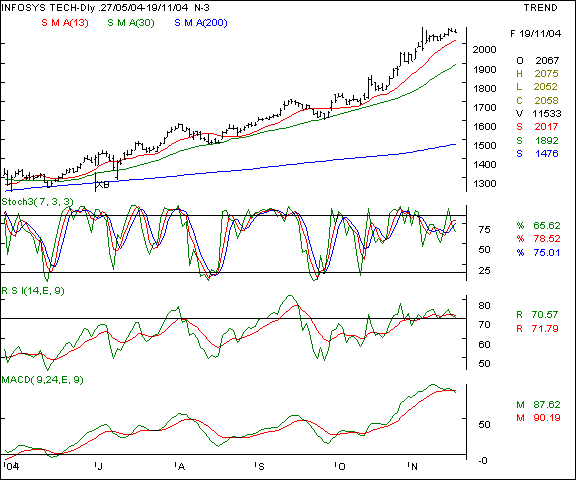
Infosys - This software bell weather has been repeatedly recommended by us in this edition as well as the daily ones. The target price for the counter was stated as the 2150 - 2200 in the medium / longer term, which we re-affirm. We advocate a buy on major declines for the savvy and discerning investor.
Your call of action - .
-
Investors / cash segment players - Buy on declines to the 2000 mark and hold with a stop loss at the 1940 levels. Expect profit taking at the 2075 - 2085 in the short / medium term in a conducive market.
-
Aggressive F&O traders - Buy the December futures in a declining market at the 2010 - 2015 and hold with a stop loss at the 1975. Expect to book profits at the 2060 - 2070 levels in the near term in a conducive market.
-
Derivatives contract size - Market lot = 200 shares. F&O margin = approx Rs 70,000 (subject to change daily )
ACC I Dr Reddy I Glaxo I HDFC I Infosys I IPCL I Raymond I Reliance I BSE Sensex I Nifty I CNX-IT I Dow Jones I Nasdaq I FTSE I Top I Close window I Print page
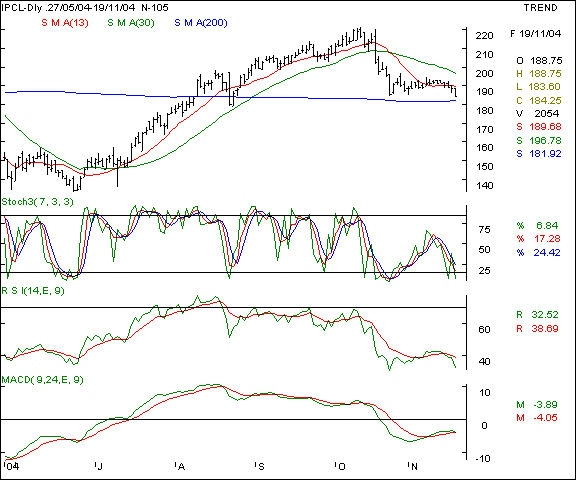
IPCL - This Reliance group company has been under the hammer as the scrip makes a lower tops formation on the charts. The 182 levels are a crucial double bottoms formation and also the 200 day SMA level. Should this important technical threshold support be violated, we expect a further attrition in prices. The oscillators are pointing towards a weakness in the undertone. We recommend a short sell on the counter below the 181 mark, if the fall is on higher volumes.
Your call of action - .
-
Investors / cash segment players - avoid.
-
Aggressive F&O traders - Short the December futures ( quoting at Rs 2 premium to cash) below the 182 levels and hold with a stop loss at the 187 levels. Expect profit taking at the 174 - 176 in a weak market.
-
Derivatives contract size - Market lot = 1100 shares. F&O margin = approx Rs 36,000 (subject to change daily )
ACC I Dr Reddy I Glaxo I HDFC I Infosys I IPCL I Raymond I Reliance I BSE Sensex I Nifty I CNX-IT I Dow Jones I Nasdaq I FTSE I Top I Close window I Print page
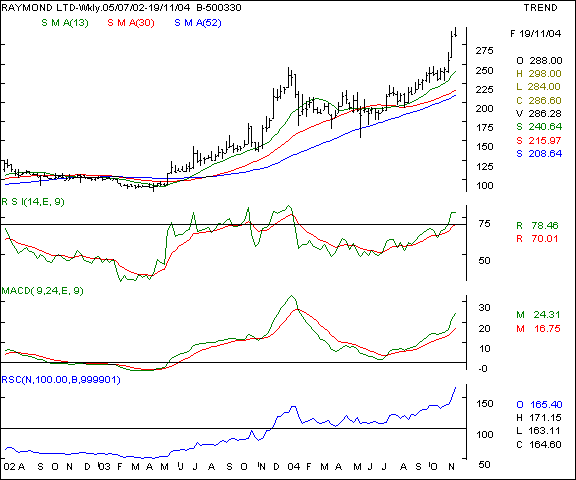
Raymond - This textiles major is in a major uptrend as the chart indicates. The scrip makes higher tops and bottoms formations and is a market out-performer. This company is on a high growth trajectory as the export markets open up in 2005 and the foray in the branded garments is gaining momentum. We recommend a buy on declines for the patient investor.
Your call of action - .
-
Investors / cash segment players - Buy on major declines to the 260 - 265 mark and leave room for averaging upto the 240 mark. Maintain a stop loss at the 215 levels. Expect profit taking at the 300 + levels in a few months time frame in a conducive market.
-
Aggressive F&O traders - F&O n/a.
-
Derivatives contract size - F&O n/a.
ACC I Dr Reddy I Glaxo I HDFC I Infosys I IPCL I Raymond I Reliance I BSE Sensex I Nifty I CNX-IT I Dow Jones I Nasdaq I FTSE I Top I Close window I Print page
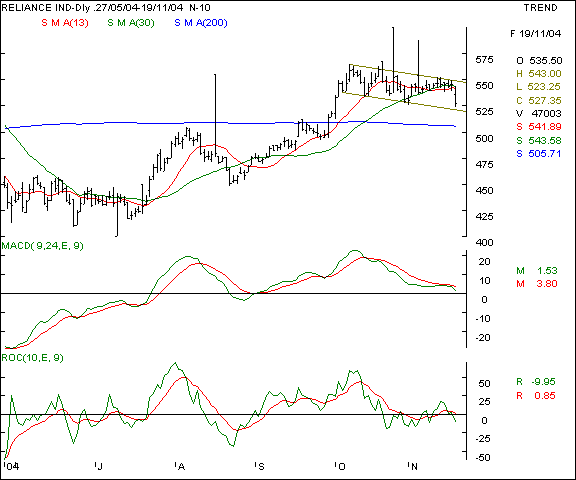
Reliance Industries - this scrip is in the eye of the storm and is likely to influence market trends in the coming days. The immediate picture is that of weakness as the stock is making lower tops and bottoms formations. A break below the 518 - 520 mark will aggravate the weakness and possibly take the stock to the 505 / 510 mark, which also happens to be the 200 day SMA support. A consistent close below the 520 levels will also generate a confirmed sell signal. We recommend a short sell on that confirmation signal.
Your call of action - .
-
Investors / cash segment players - n/a.
-
Aggressive F&O traders - sell the December futures when the spot price falls below the 520 and hold with stop loss of Rs 5 - 6. Expect to book profits of Rs 10 in a conducive market.
-
Derivatives contract size - Market lot = 600 shares. F&O margin = approx Rs 56,000 (subject to change daily )
ACC I Dr Reddy I Glaxo I HDFC I Infosys I IPCL I Raymond I Reliance I BSE Sensex I Nifty I CNX-IT I Dow Jones I Nasdaq I FTSE I Top I Close window I Print page
|
Indices - domestic |
BSE Sensex - the Sensex has cracked down to fall into the channel again after a 9 session bullishness. The immediate support is at the 5930 levels and the resistance will be at the 6025 - 6035 levels in the coming week. We expect the markets to remain news driven and volatile.
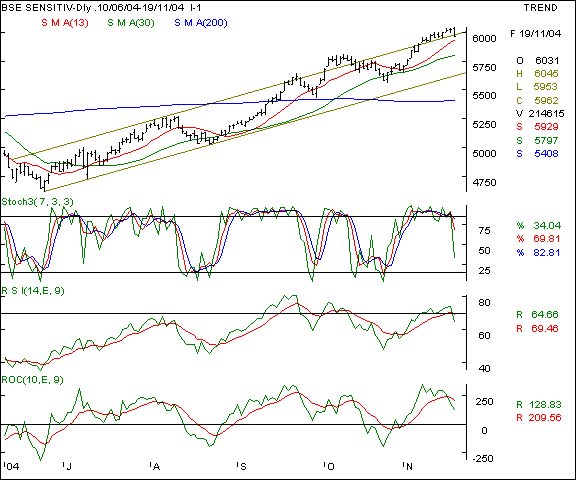
Your call of action - Since the Sensex futures are not very liquid, we suggest trading the Nifty 50 instead.
Nifty 50 - The Nifty has not managed to stay above the channel top, unlike the BSE Sensex. The immediate support will be at the 1860 levels, below which the 1830 - 1835 levels will see some immediate support in the near term. On the upsides, the 1888 - 1894 levels will remain the resistance points in the near term.
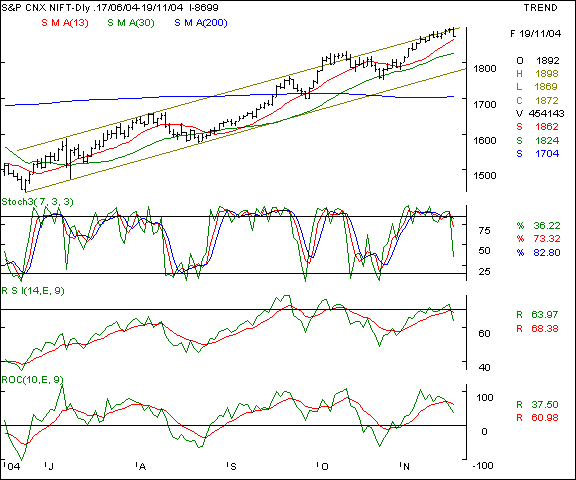
Your call of action - We recommend selling short, if the spot falls below the 1861 levels and holding with a stop loss upto the 1871 - 1873 levels. Expect profit taking at the 1845 levels in the near term. Since volatility is likely to be high, the exposure should be thin.
CNX IT - This index is showing high relative strength to the Nifty and the Sensex and the chart pattern is clearly stronger. Noticeable aspect is a clear higher tops and bottoms formation which is an indicator of strength. The 2800 levels are a strong floor level for this index where buying should be contemplated and a stop loss of 2750 should be maintained. Profit taking is advocated at the 2875 - 2900 levels in the short / medium term.
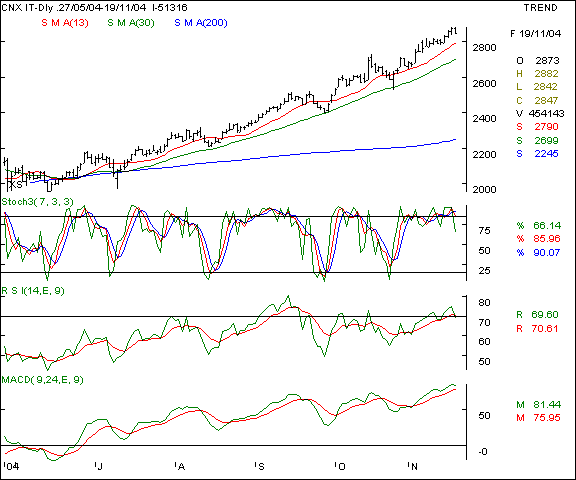
Your call of action - Refer above.
|
Indices - international |
Dow Jones Industrial Average - This old economy benchmark index has encountered resistance at the 10600 levels whereas we had advocated a selloff at the 10670 levels in the previous weeks edition. The reversal is also a bar reversal as the intraweek high is the significant high of the current upmove. Support is likely at the 10280 levels in the coming days.
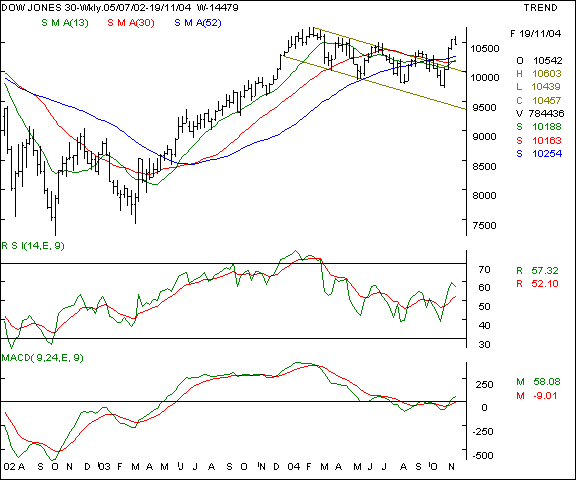
Your call of action - Since Indian investors are not allowed to trade in overseas markets, this is a pure academic study.
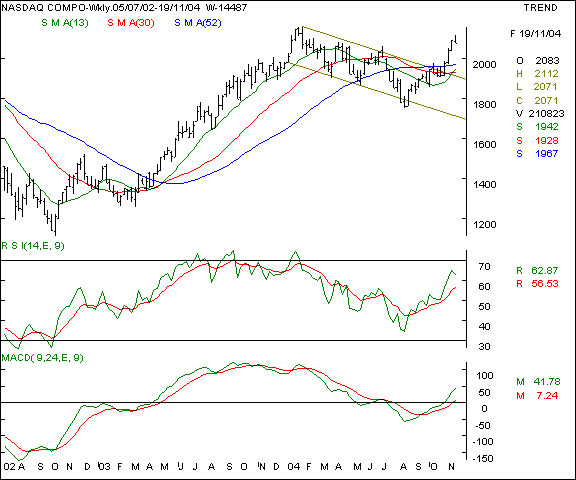
Nasdaq - This technology laden index is making similar moves as the Dow Jones above. The 2015 / 1995 levels remain a crucial support area below which this index should not sink, if the uptrend is to continue. The 2120 levels will be a resistance area.
Your call of action - Since Indian investors are not allowed to trade in overseas markets, this is a pure academic study.
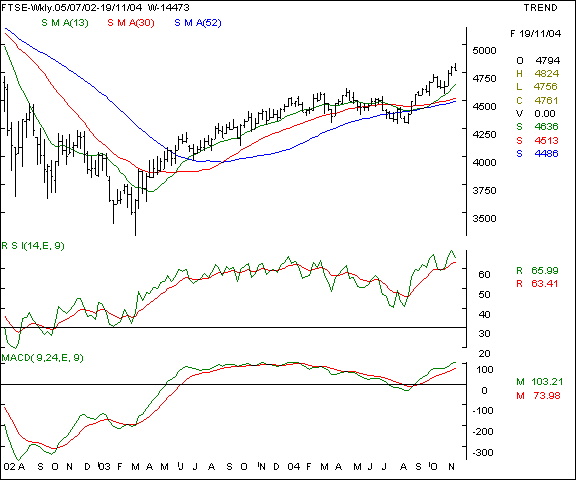
FTSE - This UK index has also exhibited a bar reversal as the index has closed lower than the open. The 4890 levels advocated last week have not been achieved and the support at lower levels will be seen at the 4635 levels. The 4850 - 4875 levels will be a resistance area in the coming week.
Your call of action - Since Indian investors are not allowed to trade in overseas markets, this is a pure academic study.
|
Trading tips for the week |
-
The put / call ratio is climbing and is currently at the 0.42 : 1 levels and the outstanding positions in the derivatives segment have shown a slight rally. The FII investments are continuing steadily.
-
There is offloading at higher levels in stock futures. That indicates a cautious approach as long positions in individual stocks is being hedged by Nifty shorts which have reached the 1.21 : 1 levels.
-
The current week is crucial for the markets as the Reliance issue coupled with the November expiry will have a bearing on the sentiments.
-
Trades must be executed in small volumes due to the higher volatility expected. Trade fewer counters and conserve cash for future opportunities.
-
Standby for fresh recommendations via SMS on a real - time basis.
- Have a profitable week.
- Vijay L Bhambwani
- Ceo :- Bsplindia.com
The author is a Mumbai based investment consultant and invites feedback at Vijay@BSPLindia.com and ( 022 ) 23438482 / 23400345.
SEBI disclosure :- The author has no positions in any securities mentioned above.
- While all due care has been taken while in compiling the data enclosed herein, we cannot be held responsible for errors, if any, creeping in. Please consult an independent qualified investment advisor before taking investment decisions. This mail is not sent unsolicited, and only advisory in nature. We have accepted no consideration from any company mentioned above and recommend taking decisions on merits of the stocks from our viewpoint. This email is being sent to you as a paid subscriber. Please protect your interests and ours by not disclosing the contents to any un-authorised person/s
Legal notice :- The Professional Ticker Reader is a trademark of Bhambwani Securities (P) Ltd. and any un-authorised replication / duplication in part or full will be infringing our trademark and will result in legal action being enforced on the infringing persons / parties.