Dow
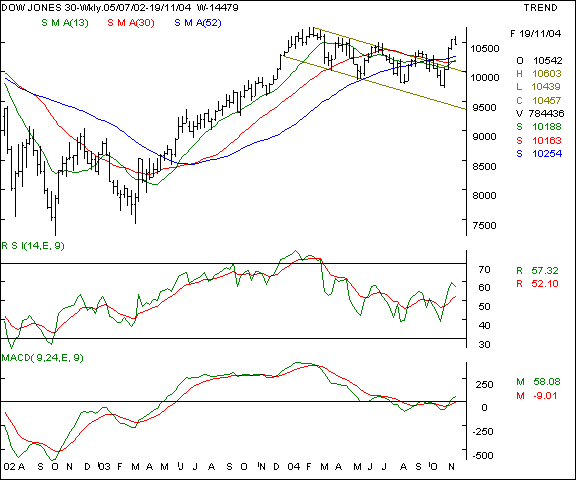
Jones Industrial Average - This old economy benchmark index
has encountered resistance at the 10600 levels whereas we had advocated a
selloff at the 10670 levels in the previous weeks edition. The reversal is
also a bar reversal as the intraweek high is the significant high of the
current upmove. Support is likely at the 10280 levels in the coming days.

Your
call of action - Since Indian
investors are not allowed to trade
in overseas markets, this is a pure
academic study.
Nasdaq
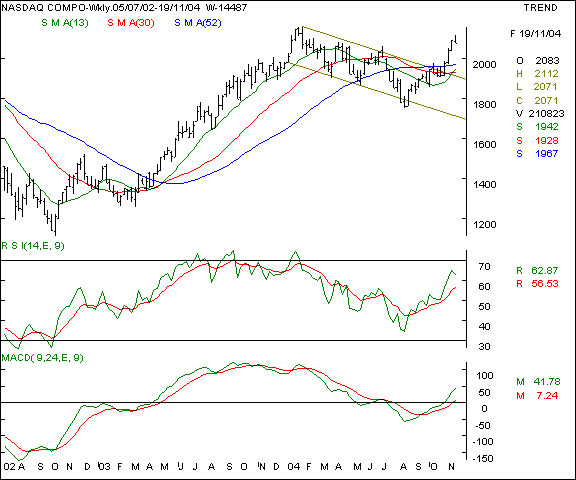
- This technology laden index is making similar moves as the Dow Jones
above. The 2015 / 1995 levels remain a crucial support area below which
this index should not sink, if the uptrend is to continue. The 2120 levels
will be a resistance area.

Your
call of action - Since Indian
investors are not allowed to trade
in overseas markets, this is a pure
academic study.
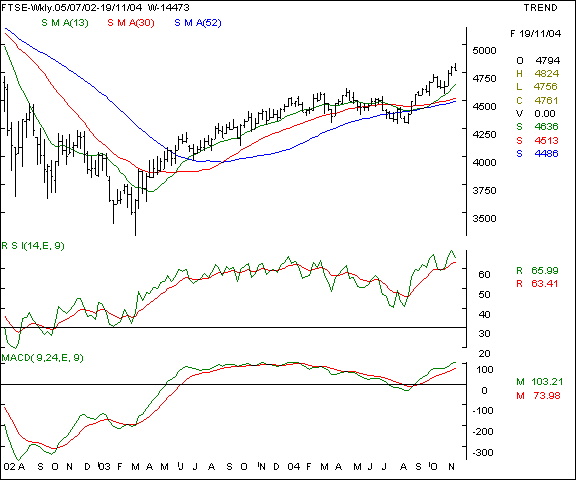
FTSE
- This UK index has also exhibited a bar reversal as the index has closed
lower than the open. The 4890 levels advocated last week have not been
achieved and the support at lower levels will be seen at the 4635 levels.
The 4850 - 4875 levels will be a resistance area in the coming week.

Your
call of action - Since Indian
investors are not allowed to trade
in overseas markets, this is a pure
academic study.