Dow
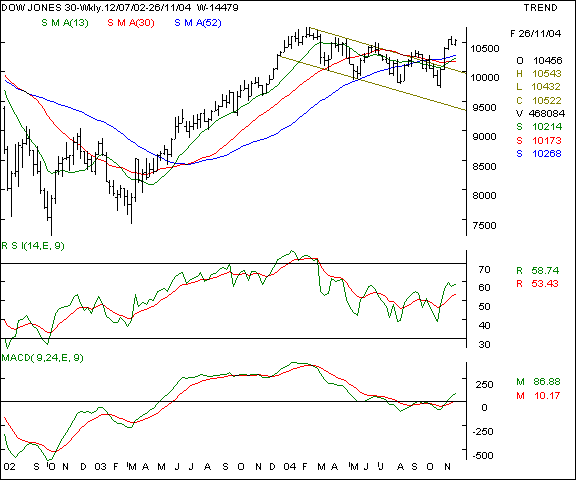
Jones Industrial Average - Last week we had advocated that the
Dow had broken out of a channel which is also a flag formation. The 10640
levels will be an immediate resistance, above which the 10800 levels maybe
likely. Downside support exists at the 10390 levels in the coming week.
The US markets are gearing up for Christmas and the shopping season will
determine the consumer buying preferences and state of the US economy.

Your
call of action - Since Indian
investors are not allowed to trade
in overseas markets, this is a pure
academic study.
Nasdaq
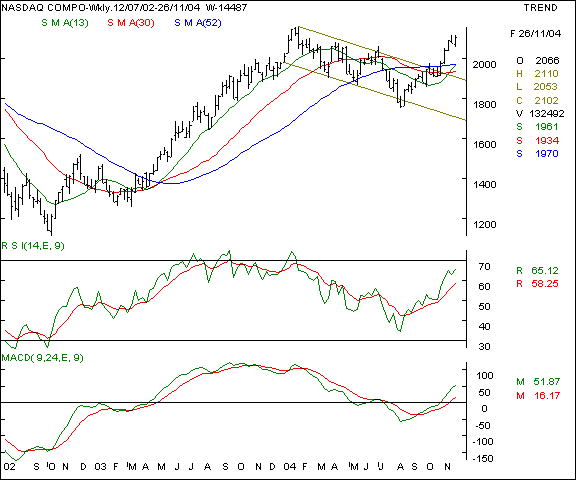
- The technology laden Nasdaq is showing similar signs of a breakout like
the Dow Jones above and is likely to find support at the 2034 levels on
the downside. Resistance at the higher levels is likely at the 2165
levels. A breakout above the 2115 levels will be a positive trigger for
the Nasdaq.

Your
call of action - Since Indian investors are not
allowed to trade in overseas markets, this is a pure academic study.
FTSE
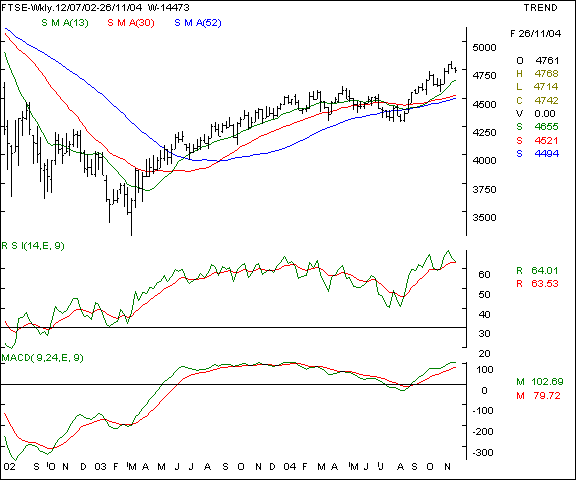
- The FTSE is under performing the USA markets and is likely to
consolidate as long as a breakout above the 4820 levels are not sustained.
Lower levels will see support at the 4650 levels and the FTSE should not
fall below this level if the outlook is to remain bullish.

Your
call of action - Since Indian
investors are not allowed to trade
in overseas markets, this is a pure
academic study.