- All the extra edge you need
- Unit of Bsplindia.com
|
Volatile markets - friend or foe ? Nov 15 2005 The last quarter of this calendar year promises to be an unforgettable one for most of us, and that seems to an understatement of sorts ! Just when we were preparing for a smug and bullish diwali, the markets flattered to deceive. The days of thunder from Oct 05 2005 saw a precipitous slide that tested the nerves of most veteran traders. Support levels tumbled one after the other and with each violation, trades were stopped out for various reasons - margin calls, panic, broker advice and what have you. Probably more wealth was destroyed in these four weeks than was earned by the retail segment in as many months or more. How can you avoid these pitfalls in the future is a separate question altogether, we go a step further - is it possible to profit from such an occurrence ? And how can you actually profit from such a phenomenal move ? |
Tech school |
| Learn to earn |
There are essentially two types of predictive analysis that a trader employs to profit from the markets. One is the directional analysis ( technical trends ) that is facilitated by technical chart reading. The other is volatility analysis that is possible using derivative data. We at Bsplindia.com have been providing our investors a dedicated f&o newsletter ( Derivatives Denizens ) for over 30 months now. The data is exhaustive and a potential mineful of profitable opportunities if used efficiently. We take you through the paces of volatility management using the legendary Black - Scholes model -
-
Volatility is your foe or friend - you decide how you want to relate to it. If it frightens you, its your biggest enemy. Halt ! Read no further !
-
Keep track of volatility provided by us in our f&o newsletter. It's segregated segment-wise - market wide volatility, index wise volatility and volatility of the top 6 heavy-weights. A rudimentary knowledge of excel worksheets would be an additional advantage.
-
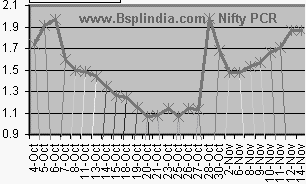
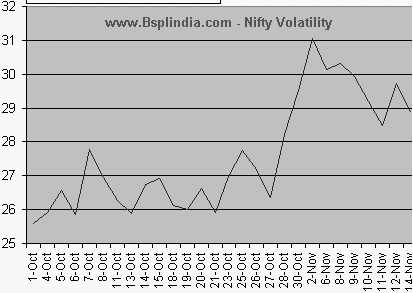
We present a graphical depiction of the volatility vis-a-vis the Nifty PCR. The object of this study is to gauge the direction of the trade winds blowing. Please note that the markets peaked on Oct 05 2005 and so did the Nifty PCR. Thereafter, the Nifty has seen a gradual but steady decline in the PCR, which shows a stealthy short covering by the bears. Between Oct 21 - 27, the bears stopped creating fresh short sales and the markets bottomed out on Oct 28, 2005. The Volatility shows a quantum leap thereafter, which shows that the bulls got back in action and ramped the markets back in action.
 |
The Nifty PCR has been escalating in tandem with the volatility which shows the bears getting back in action at higher levels and offering short sales to prepare for the next fall - which may take quite a while in coming.
The lesson to learn from the above is as follows -
| Bull market | Outlook | Bear market | Outlook |
| Rising Volatility - falling PCR | Uptrend | Rising / steady vol - falling PCR | Downtrend |
| Slowing volatility - rising PCR | Uptrend easing | Slowing volatility - steady PCR | Downtrend easing |
| Falling volatility - rising PCR | Uptrend reversing | Rising volatility - rising PCR | Breakout possible |
-
It maybe added that this system will work best with the scrips that are more volatile than the broader markets and their peer groups. The data is provided everyday in the f&o newsletter where volatility is arranged in descending order.
In the next phase of volatility trading, we will learn swing trading on volatility based momentum.
Till then, have a profitable day.
- Vijay L Bhambwani
- Ceo - Bsplindia.com
Your feedback is important ! Please click here to let us know your views. Click here to inform a friend about this page on our website.


