Dow
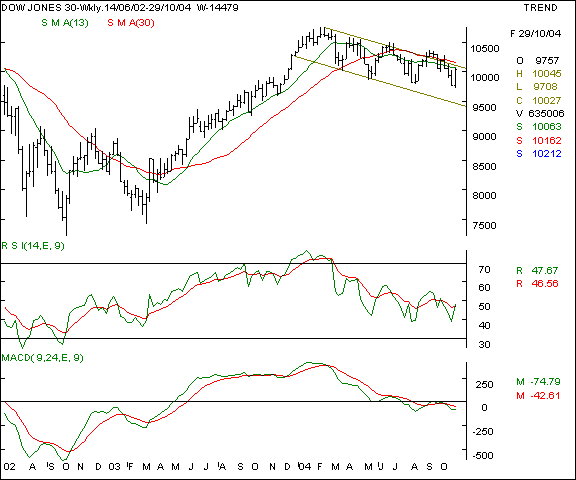
Jones Industrial Average - this NYSE old economy index has
risen on lower volumes, primarily due to easing oil prices. The channel
top and the 30 week SMA remain the formidable hurdles which the index
needs to surpass. That makes the upsides limited to the 10150 - 10175 in
the coming week, beyond which the bulls may come back. On the lower side,
watch the 9845 levels.

Your
call of action - Since Indian
investors are not allowed to trade
in overseas markets, this is a pure
academic study.
Nasdaq
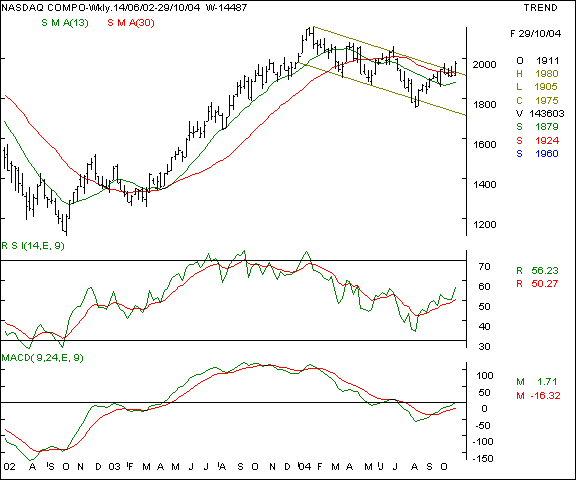
- the technology / biotech laden index is showing higher relative strength
as compared to the Dow Jones and is above the channel top. The oscillators
are showing a bullish undertone and the index may test the recent top at
the 2040 levels if the index remains above the 2000 mark. On the lower
side, expect the 1895 to be a support

Your
call of action - Since Indian investors are not
allowed to trade in overseas markets, this is a pure academic study.
FTSE
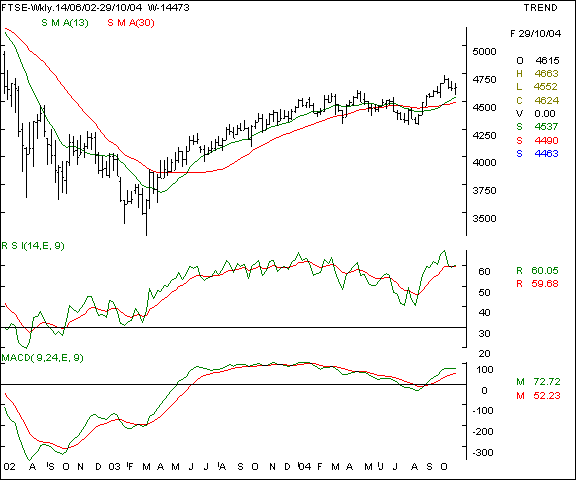
- This index is showing a sideways movement and short term support exists
at the 4500 levels. Upsides will be capped at the 4765 in the coming week.
Beyond these levels, take a fresh look on the indices.

Your
call of action - Since Indian
investors are not allowed to trade
in overseas markets, this is a pure
academic study.