- Your accurate, authentic and affordable guide to investing
June 02, 2005
-
- Ballarpur Industries - headed for 140
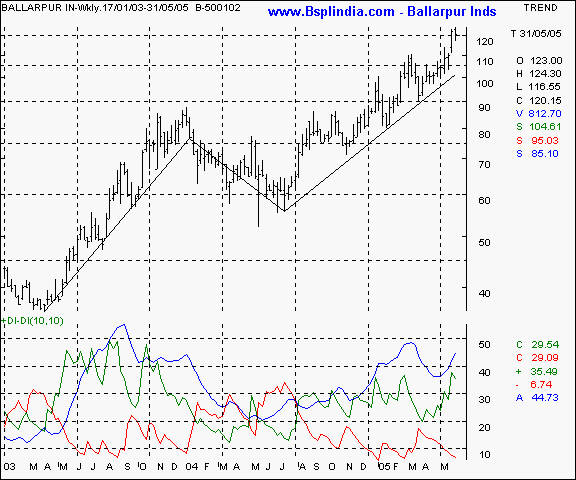
A recent addition into the f&o list, BILT has been surging as the price graph below indicates. Currently at 9 year highs, the scrip is making an interesting chart pattern - elliot wave enthusiasts would identify with. Dow enthusiasts will note the inverted head and shoulders formation on the monthly chart ( not enclosed in this report ) which co-incides with the target objective of the elliot theory. With these two strong triggers, we recommend a buy on the scrip with a 2 - 3 month view. A stop loss would be advisable at the 110 - 112 levels.
While a 140 target is a conservative objective, the next impulse move is likely to propel the scrip even higher. We'll keep you updated on this story frequently.
| Your call of action |
Buy in the cash / futures segment as per your risk appetite and hold with a stop loss at the 110 levels. For every 5 Rupee gain in the price, keep revising the stop loss higher by Rs 3 as that will protect your capital beyond the 130 - 135 space.
Your feedback is important ! Please click here to let us know your views. Click here to inform a friend about this page on our website.
- Have a profitable day.
- Vijay L Bhambwani
- Ceo :- Bsplindia.com
The author is a Mumbai based investment consultant and invites feedback at Vijay@BSPLindia.com and ( 022 ) 23438482 / 23400345.
SEBI disclosure - The author has no positions in the stocks mentioned above.
- While all due care has been taken while in compiling the data enclosed herein, we cannot be held responsible for errors, if any, creeping in. Please consult an independent qualified investment advisor before taking investment decisions. This mail is not sent unsolicited, and only advisory in nature. We have accepted no consideration from any company mentioned above and recommend taking decisions on merits of the stocks from our viewpoint. This email is being sent to you as a paid subscriber. Please protect your interests and ours by not disclosing the contents to any un-authorised person/s.
Legal notice :- The Professional Ticker Reader is a trademark of Bhambwani Securities (P) Ltd. and any un-authorised replication / duplication in part or full will be infringing our trademark and will result in legal action being enforced on the infringing persons / parties.

