- The Professional Ticker Reader TM
- Your accurate, authentic and affordable guide to investing
July 05, 2003
-
Markets rally further. Sensex gains 39 points.
- Higher volumes, positive breadth as old economy stocks rally.
-
Weekly statistics
| Indices | Open | High | Low | Close | Change |
| BSE - 30 | 3585 | 3661 | 3584 | 3622 | + 39.28 |
| BSE - 200 | 450 | 461 | 449 | 457 | + 08.54 |
| NSE - 50 | 1125 | 1150 | 1125 | 1138 | + 12.90 |
| Dow Jones | 9070 + 81 | Nasdaq | 1663 + 38 | FTSE |
4021(-) 46 |
| Advances | 7628 | Declines | 5482 | Put / Call ratio - 5628 : 16901 | |
| FII Investments | Rs + 510 Crs July 1 - 3 | Domestic Funds | Rs + 1 Cr July 1 - 3 | ||
The BSE & NSE combined weekly value of shares advancing was Rs. 14683 crores and the value of shares declining was Rs. 8937 crores. This indicates a broader buying bias. The weekly total traded volume on the BSE was Rs. 7027 Crores. The weekly total traded volume on the NSE was Rs. 16693 Crores.
|
The week that was |
The week saw a firm movement in the benchmark indices as the markets consolidated their earlier gains. The traded volumes hit their new recent highs in both the cash and derivatives segments. The indices themselves are at near 15 month highs and are primarily bolstered by the old economy stocks. The PSU disinvestment expectations are a major source of optimism as the players expect big ticket selloffs before the elections. The Sensex was boosted by BHEL, Castrol, Cipla, Dr. Reddy, Glaxo, Hero Honda, HPCL, ICICI Bank, ITC Ltd, L&T, MTNL, Ranbaxy, Reliance, SBI, Telco, Tisco and Zee Telefilms. The Sensex was dragged down by ACC, Bajaj Auto, BSES, Grasim, HCL Tech, HDFC, Hindalco, Infosys, Nestle and Satyam Computers. The rupee ended the week at 46.32 levels against the US $.
|
Likely triggers |
The strengthening rupee is likely to exert downward pressure on software exporting companies' bottomlines. The Q1 announcement by these companies will further clarify the earnings outlook going forward. The markets being in bullish hands, the action is likely to be concentrated on the old economy stocks. Expect the automobiles, pharmaceuticals, oil & gas and select infrastructure counters to keep the indices firm. The overseas markets have seen mild gains in the USA and slight losses in the UK. We expect the 1690 & 9250 levels to be trend determinators on the US markets. Only above these levels will the markets there rise further. The PSU disinvestment story is likely to keep the trader interest alive in these stocks in the coming week. Overall, expect a volatile market with a bullish bias.
|
Technicals |
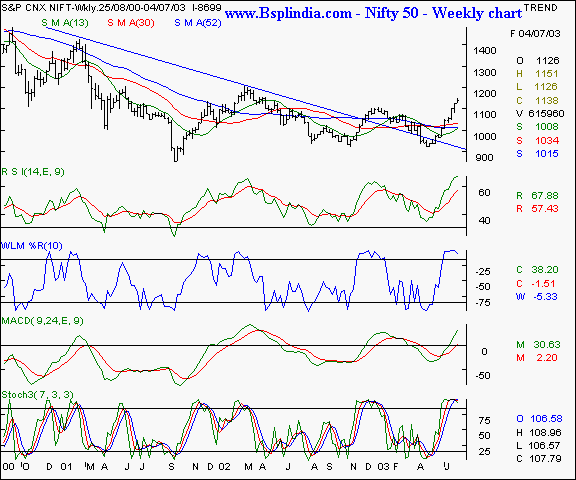
The weekly bar chart of the Nifty shows a continued rising bottoms and tops formation - a bullish sign. It indicates an intact bullish sentiment as the markets are firmly in the hands of institutional and big operator hands. The Nifty was advocated by us to face resistance at the 1150 - 1155 band, which has still not been surpassed. That is the congestion band from where the markets were unable to recover in the fortnight of April 05 - April 19, 2002. The fall thereafter has been historic. Since this is a 15 month old resistance, we feel that a lot of investors / traders who have been stuck with bull positions will rush out of their investments, as their break-even points are achieved. That is likely to halt the upmove of the index temporarily. This may also be the correction that the markets have been looking for. Should the 1155 resistance be surpassed easily and that too with high volumes, expect the upmove to hit 1200 levels after high volatility and rapid corrections. On the lower side, watch the 1115 support for short term and 1085 for a trend reversal.
The short term momentum oscillators are in the overbought zone and that lends credence to the theory that a correction is around the corner.
Our outlook on the Nifty remains positive - barring corrective falls.
| Your call of action |
For stock specific recommendations, please refer to our special edition " Flavours of the week."
- Have a profitable week.
- Vijay Bhambwani
- Ceo :- Bsplindia.com
The author is a Mumbai based investment consultant and invites feedback at Vijay@BSPLindia.com and (022) 23438482 / 23400345.
SEBI disclosure - The author has no positions in the stocks mentioned above.
- While all due care has been taken while in compiling the data enclosed herein, we cannot be held responsible for errors, if any, creeping in. Please consult an independent qualified investment advisor before taking investment decisions. This mail is not sent unsolicited, and only advisory in nature. We have accepted no consideration from any company mentioned above and recommend taking decisions on merits of the stocks from our viewpoint. This email is being sent to you as a paid subscriber. Please protect your interests and ours by not disclosing the contents to any un-authorised person/s.
Legal notice :- The Professional Ticker Reader is a trademark of Bhambwani Securities (P) Ltd. and any unauthorised replication / duplication in part or full will be infringing our trademark and will result in legal action being enforced on the infringing persons / parties.
